29
/es/
es
AIzaSyAYiBZKx7MnpbEhh9jyipgxe19OcubqV5w
April 1, 2024
26543
Early-demographic dividend
EAR
false
2
1
Gross capital formation (constant 2010 US$)
2016,2015,2014,2013,2012,2011,2010,2009,2008,2007,2006,2005,2004,2003,2002,2001,2000,1999,1998,1997,1996,1995,1994,1993,1992,1991,1990,1989,1988,1987,1986,1985,1984,1983,1982,1981,1980,1979,1978,1977,1976,1975,1974,1973,1972,1971,1970,1969,1968,1967,1966,1965,1964,1963,1962,1961
Estas estadísticas en otros países:
AfghanistanAlbaniaAlgeriaAngolaAntigua and BarbudaArab WorldArgentinaArmeniaArubaAustraliaAustriaAzerbaijanBahamas, TheBahrainBangladeshBarbadosBelarusBelgiumBelizeBeninBermudaBhutanBoliviaBosnia and HerzegovinaBotswanaBrazilBrunei DarussalamBulgariaBurkina FasoBurundiCabo VerdeCambodiaCameroonCanadaCaribbean small statesCentral African RepublicCentral Europe and the BalticsChadChileChinaColombiaComorosCongo, Dem. Rep.Congo, Rep.Cote d'IvoireCroatiaCubaCyprusCzech RepublicDenmarkDominicaDominican RepublicEarly-demographic dividendEast Asia & PacificEast Asia & Pacific (excluding high income)East Asia & Pacific (IDA & IBRD countries)EcuadorEgypt, Arab Rep.El SalvadorEquatorial GuineaEritreaEstoniaEthiopiaEuro areaEurope & Central AsiaEurope & Central Asia (excluding high income)Europe & Central Asia (IDA & IBRD countries)European UnionFaroe IslandsFinlandFragile and conflict affected situationsFranceGabonGambia, TheGeorgiaGermanyGhanaGreeceGrenadaGuatemalaGuineaGuinea-BissauGuyanaHaitiHeavily indebted poor countries (HIPC)High incomeHondurasHong Kong SAR, ChinaHungaryIBRD onlyIcelandIDA & IBRD totalIDA blendIDA onlyIDA totalIndiaIndonesiaIran, Islamic Rep.IraqIrelandIsraelItalyJamaicaJapanJordanKazakhstanKenyaKorea, Rep.KosovoKuwaitKyrgyz RepublicLao PDRLate-demographic dividendLatin America & Caribbean Latin America & Caribbean (excluding high income)Latin America & the Caribbean (IDA & IBRD countries)LatviaLeast developed countries: UN classificationLebanonLiberiaLithuaniaLow & middle incomeLow incomeLower middle incomeLuxembourgMacao SAR, ChinaMacedonia, FYRMadagascarMalawiMalaysiaMaliMaltaMauritaniaMauritiusMexicoMiddle East & North AfricaMiddle East & North Africa (excluding high income)Middle East & North Africa (IDA & IBRD countries)Middle incomeMoldovaMongoliaMontenegroMoroccoMozambiqueNamibiaNepalNetherlandsNew ZealandNicaraguaNigerNigeriaNorth AmericaNorwayOECD membersOmanOther small statesPakistanPanamaParaguayPeruPhilippinesPolandPortugalPost-demographic dividendPre-demographic dividendPuerto RicoQatarRomaniaRussian FederationRwandaSaudi ArabiaSenegalSerbiaSeychellesSierra LeoneSingaporeSlovak RepublicSloveniaSmall statesSouth AfricaSouth AsiaSouth Asia (IDA & IBRD)South SudanSpainSri LankaSt. Kitts and NevisSt. LuciaSt. Vincent and the GrenadinesSub-Saharan Africa Sub-Saharan Africa (excluding high income)Sub-Saharan Africa (IDA & IBRD countries)SudanSurinameSwazilandSwedenSwitzerlandTajikistanTanzaniaThailandTimor-LesteTogoTongaTrinidad and TobagoTunisiaTurkeyTurkmenistanUgandaUkraineUnited Arab EmiratesUnited KingdomUnited StatesUpper middle incomeUruguayUzbekistanVanuatuVenezuela, RBVietnamWest Bank and GazaWorldYemen, Rep.ZambiaZimbabwe línea de tiempo (timeline):
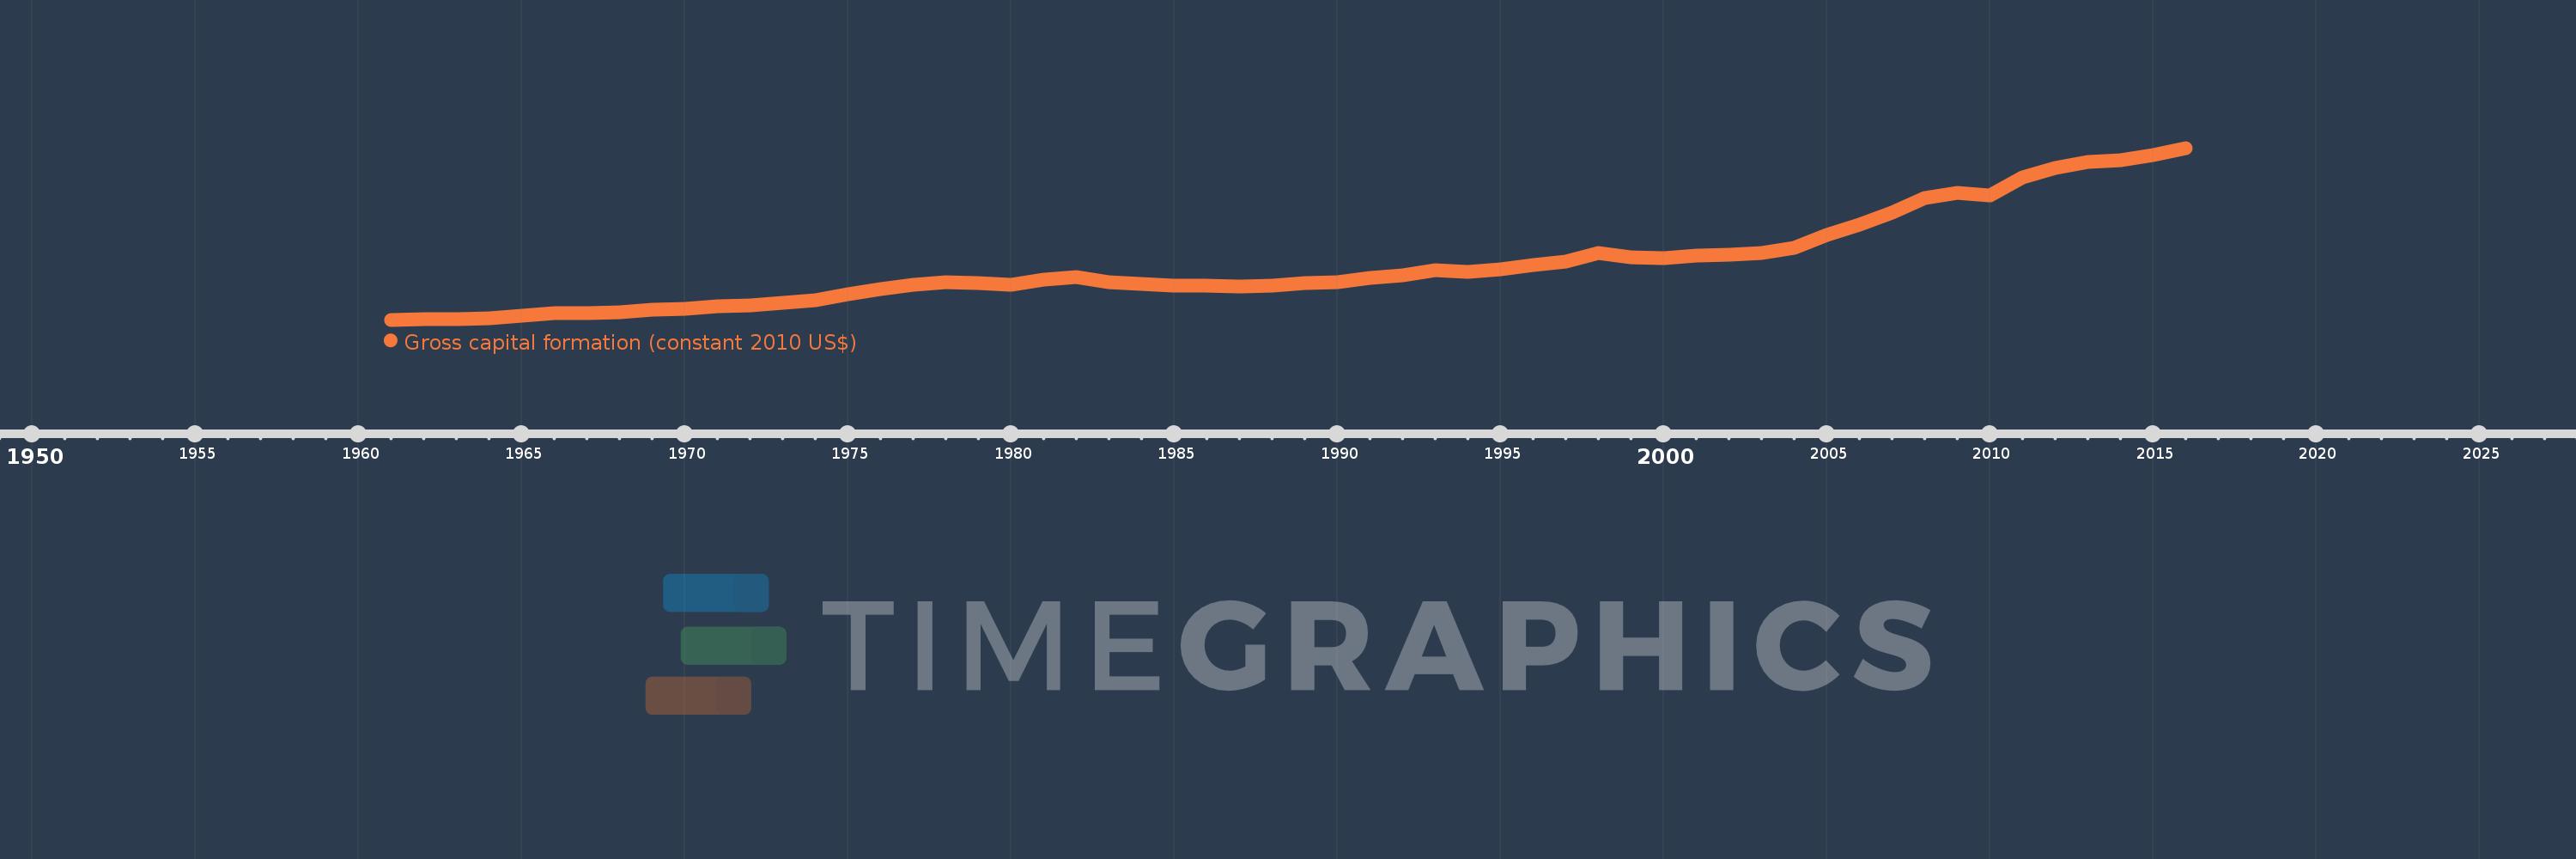
En esta escala de tiempo se presenta un gráfico de 1961 y 2016 de Early-demographic dividend. Los datos de 1960 están ausentes. El número de observaciones reales por fecha: 56.
Fuente (nombre):
Indicadores del desarrollo mundial
Fuente (organización):
World Bank national accounts data, and OECD National Accounts data files.
Categorías:
Economy & Growth
Se ha actualizado:
23 abr 2017 año
Los indicadores de los cambios de valor en los últimos años
En promedio:
1.042 billones
Mínimo:
194.678 bn
1 ene 1961 año
Máximo:
2.832 billones
1 ene 2016 año
A la fecha de observación
Valor
Cambio absoluto
El cambio con respecto al valor anterior
1 ene 1961 año
194.678 bn
+194.678 bn
0.0%
1 ene 1962 año
207.851 bn
+13.173 bn
6.77%
1 ene 1963 año
204.34 bn
-3.511 bn
-1.69%
1 ene 1964 año
215.431 bn
+11.091 bn
5.43%
1 ene 1965 año
252.939 bn
+37.508 bn
17.41%
1 ene 1966 año
290.313 bn
+37.374 bn
14.78%
1 ene 1967 año
294.979 bn
+4.666 bn
1.61%
1 ene 1968 año
315.289 bn
+20.31 bn
6.89%
1 ene 1969 año
350.533 bn
+35.244 bn
11.18%
1 ene 1970 año
367.211 bn
+16.679 bn
4.76%
1 ene 1971 año
401.754 bn
+34.542 bn
9.41%
1 ene 1972 año
414.977 bn
+13.223 bn
3.29%
1 ene 1973 año
448.131 bn
+33.155 bn
7.99%
1 ene 1974 año
487.435 bn
+39.304 bn
8.77%
1 ene 1975 año
587.228 bn
+99.792 bn
20.47%
1 ene 1976 año
659.162 bn
+71.934 bn
12.25%
1 ene 1977 año
733.544 bn
+74.382 bn
11.28%
1 ene 1978 año
775.443 bn
+41.899 bn
5.71%
1 ene 1979 año
762.527 bn
-12.916 bn
-1.67%
1 ene 1980 año
734.828 bn
-27.699 bn
-3.63%
1 ene 1981 año
806.276 bn
+71.448 bn
9.72%
1 ene 1982 año
848.126 bn
+41.849 bn
5.19%
1 ene 1983 año
775.89 bn
-72.235 bn
-8.52%
1 ene 1984 año
744.356 bn
-31.534 bn
-4.06%
1 ene 1985 año
719.07 bn
-25.286 bn
-3.4%
1 ene 1986 año
721.818 bn
+2.749 bn
0.38%
1 ene 1987 año
702.649 bn
-19.17 bn
-2.66%
1 ene 1988 año
717.597 bn
+14.949 bn
2.13%
1 ene 1989 año
751.198 bn
+33.601 bn
4.68%
1 ene 1990 año
767.574 bn
+16.376 bn
2.18%
1 ene 1991 año
833.513 bn
+65.939 bn
8.59%
1 ene 1992 año
879.166 bn
+45.653 bn
5.48%
1 ene 1993 año
960.399 bn
+81.234 bn
9.24%
1 ene 1994 año
925.6 bn
-34.799 bn
-3.62%
1 ene 1995 año
965.166 bn
+39.566 bn
4.27%
1 ene 1996 año
1.04 billones
+74.405 bn
7.71%
1 ene 1997 año
1.093 billones
+53.743 bn
5.17%
1 ene 1998 año
1.22 billones
+126.747 bn
11.59%
1 ene 1999 año
1.155 billones
-64.633 bn
-5.3%
1 ene 2000 año
1.139 billones
-16.582 bn
-1.44%
1 ene 2001 año
1.181 billones
+42.553 bn
3.74%
1 ene 2002 año
1.195 billones
+13.13 bn
1.11%
1 ene 2003 año
1.213 billones
+18.817 bn
1.58%
1 ene 2004 año
1.299 billones
+85.322 bn
7.03%
1 ene 2005 año
1.5 billones
+201.532 bn
15.52%
1 ene 2006 año
1.657 billones
+156.676 bn
10.44%
1 ene 2007 año
1.838 billones
+180.675 bn
10.9%
1 ene 2008 año
2.062 billones
+224.698 bn
12.23%
1 ene 2009 año
2.141 billones
+78.76 bn
3.82%
1 ene 2010 año
2.1 billones
-41.264 bn
-1.93%
1 ene 2011 año
2.374 billones
+274.273 bn
13.06%
1 ene 2012 año
2.526 billones
+152.294 bn
6.42%
1 ene 2013 año
2.616 billones
+89.91 bn
3.56%
1 ene 2014 año
2.648 billones
+31.961 bn
1.22%
1 ene 2015 año
2.726 billones
+77.323 bn
2.92%
1 ene 2016 año
2.832 billones
+106.542 bn
3.91%
Ranking de los países por los datos estadísticos actuales


Comentarios: