29
/es/
es
AIzaSyAYiBZKx7MnpbEhh9jyipgxe19OcubqV5w
April 1, 2024
64860
Albania
ALB
true
2
1
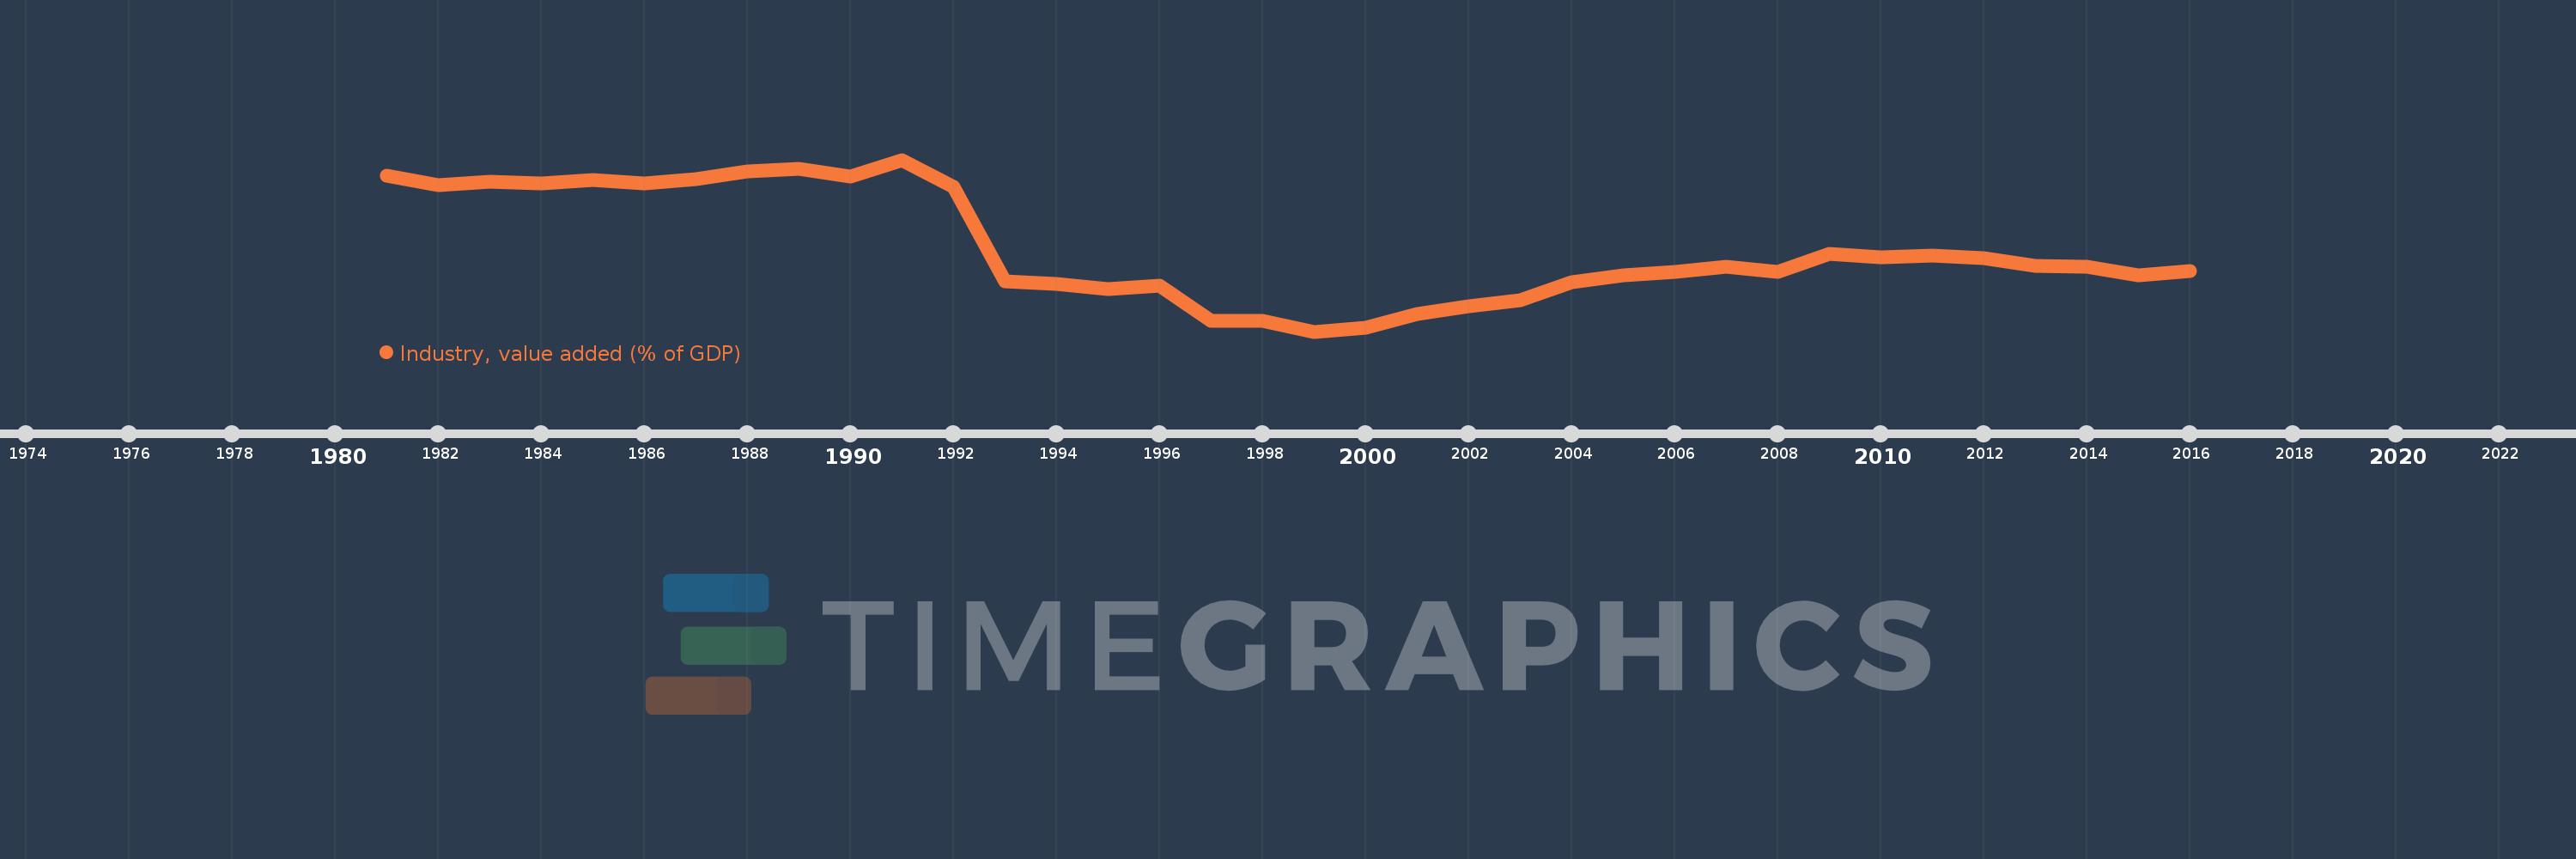
Industry, value added (% of GDP)
2016,2015,2014,2013,2012,2011,2010,2009,2008,2007,2006,2005,2004,2003,2002,2001,2000,1999,1998,1997,1996,1995,1994,1993,1992,1991,1990,1989,1988,1987,1986,1985,1984,1983,1982,1981
Estas estadísticas en otros países:
AfghanistanAlbaniaAlgeriaAndorraAngolaAntigua and BarbudaArab WorldArgentinaArmeniaArubaAustraliaAustriaAzerbaijanBahamas, TheBahrainBangladeshBarbadosBelarusBelgiumBelizeBeninBermudaBhutanBoliviaBosnia and HerzegovinaBotswanaBrazilBrunei DarussalamBulgariaBurkina FasoBurundiCabo VerdeCambodiaCameroonCanadaCaribbean small statesCayman IslandsCentral African RepublicCentral Europe and the BalticsChadChileChinaColombiaComorosCongo, Dem. Rep.Congo, Rep.Costa RicaCote d'IvoireCroatiaCubaCyprusCzech RepublicDenmarkDjiboutiDominicaDominican RepublicEarly-demographic dividendEast Asia & PacificEast Asia & Pacific (excluding high income)East Asia & Pacific (IDA & IBRD countries)EcuadorEgypt, Arab Rep.El SalvadorEquatorial GuineaEritreaEstoniaEthiopiaEuro areaEurope & Central AsiaEurope & Central Asia (excluding high income)Europe & Central Asia (IDA & IBRD countries)European UnionFijiFinlandFragile and conflict affected situationsFranceGabonGambia, TheGeorgiaGermanyGhanaGreeceGrenadaGuatemalaGuineaGuinea-BissauGuyanaHeavily indebted poor countries (HIPC)High incomeHondurasHong Kong SAR, ChinaHungaryIBRD onlyIcelandIDA & IBRD totalIDA blendIDA onlyIDA totalIndiaIndonesiaIran, Islamic Rep.IrelandItalyJamaicaJapanJordanKazakhstanKenyaKiribatiKorea, Rep.KosovoKuwaitKyrgyz RepublicLao PDRLate-demographic dividendLatin America & Caribbean Latin America & Caribbean (excluding high income)Latin America & the Caribbean (IDA & IBRD countries)LatviaLeast developed countries: UN classificationLebanonLesothoLibyaLiechtensteinLithuaniaLow & middle incomeLow incomeLower middle incomeLuxembourgMacao SAR, ChinaMacedonia, FYRMadagascarMalawiMalaysiaMaldivesMaliMaltaMarshall IslandsMauritaniaMauritiusMexicoMicronesia, Fed. Sts.Middle East & North AfricaMiddle East & North Africa (excluding high income)Middle East & North Africa (IDA & IBRD countries)Middle incomeMoldovaMongoliaMontenegroMoroccoMozambiqueMyanmarNamibiaNepalNetherlandsNew CaledoniaNew ZealandNicaraguaNigerNigeriaNorth AmericaNorwayOECD membersOmanOther small statesPacific island small statesPakistanPalauPanamaPapua New GuineaParaguayPeruPhilippinesPolandPortugalPost-demographic dividendPre-demographic dividendPuerto RicoQatarRomaniaRussian FederationRwandaSao Tome and PrincipeSaudi ArabiaSenegalSerbiaSeychellesSierra LeoneSingaporeSlovak RepublicSloveniaSmall statesSolomon IslandsSomaliaSouth AfricaSouth AsiaSouth Asia (IDA & IBRD)SpainSri LankaSt. Kitts and NevisSt. LuciaSt. Vincent and the GrenadinesSub-Saharan Africa Sub-Saharan Africa (excluding high income)Sub-Saharan Africa (IDA & IBRD countries)SudanSurinameSwazilandSwedenSwitzerlandSyrian Arab RepublicTajikistanTanzaniaThailandTimor-LesteTogoTongaTrinidad and TobagoTunisiaTurkeyTurkmenistanTuvaluUgandaUkraineUnited KingdomUnited StatesUpper middle incomeUruguayUzbekistanVanuatuVenezuela, RBVietnamWest Bank and GazaWorldYemen, Rep.ZambiaZimbabwe línea de tiempo (timeline):
En esta escala de tiempo se presenta un gráfico de 1981 y 2016 de Albania. Los datos de 1980 están ausentes. El número de observaciones reales por fecha: 36.
Fuente (nombre):
Indicadores del desarrollo mundial
Fuente (organización):
World Bank national accounts data, and OECD National Accounts data files.
Categorías:
Economy & Growth
Se ha actualizado:
23 abr 2017 año
Los indicadores de los cambios de valor en los últimos años
Mínimo:
13.11
1 ene 1999 año
Máximo:
48.201
1 ene 1991 año
A la fecha de observación
Valor
Cambio absoluto
El cambio con respecto al valor anterior
1 ene 1981 año
45.0
+45.0
0.0%
1 ene 1982 año
43.0
-2.0
-4.44%
1 ene 1983 año
43.8
+0.8
1.86%
1 ene 1984 año
43.3
-0.5
-1.14%
1 ene 1985 año
44.0
+0.7
1.62%
1 ene 1986 año
43.3
-0.7
-1.59%
1 ene 1987 año
44.2
+0.9
2.08%
1 ene 1988 año
45.8
+1.6
3.62%
1 ene 1989 año
46.3
+0.5
1.09%
1 ene 1990 año
44.8
-1.5
-3.24%
1 ene 1991 año
48.201
+3.401
7.59%
1 ene 1992 año
42.697
-5.504
-11.42%
1 ene 1993 año
23.321
-19.376
-45.38%
1 ene 1994 año
22.902
-0.419
-1.8%
1 ene 1995 año
21.731
-1.171
-5.11%
1 ene 1996 año
22.498
+0.767
3.53%
1 ene 1997 año
15.344
-7.154
-31.8%
1 ene 1998 año
15.378
+0.034
0.22%
1 ene 1999 año
13.11
-2.268
-14.75%
1 ene 2000 año
13.975
+0.865
6.6%
1 ene 2001 año
16.705
+2.731
19.54%
1 ene 2002 año
18.315
+1.61
9.63%
1 ene 2003 año
19.596
+1.281
7.0%
1 ene 2004 año
23.183
+3.587
18.31%
1 ene 2005 año
24.582
+1.398
6.03%
1 ene 2006 año
25.217
+0.635
2.58%
1 ene 2007 año
26.405
+1.189
4.71%
1 ene 2008 año
25.334
-1.071
-4.06%
1 ene 2009 año
29.022
+3.687
14.55%
1 ene 2010 año
28.216
-0.806
-2.78%
1 ene 2011 año
28.691
+0.475
1.68%
1 ene 2012 año
28.154
-0.537
-1.87%
1 ene 2013 año
26.453
-1.701
-6.04%
1 ene 2014 año
26.368
-0.084
-0.32%
1 ene 2015 año
24.648
-1.721
-6.53%
1 ene 2016 año
25.425
+0.777
3.15%
Ranking de los países por los datos estadísticos actuales


Comentarios: