29
/es/
es
AIzaSyAYiBZKx7MnpbEhh9jyipgxe19OcubqV5w
April 1, 2024
43528
Latin America & the Caribbean (IDA & IBRD countries)
TLA
false
2
1
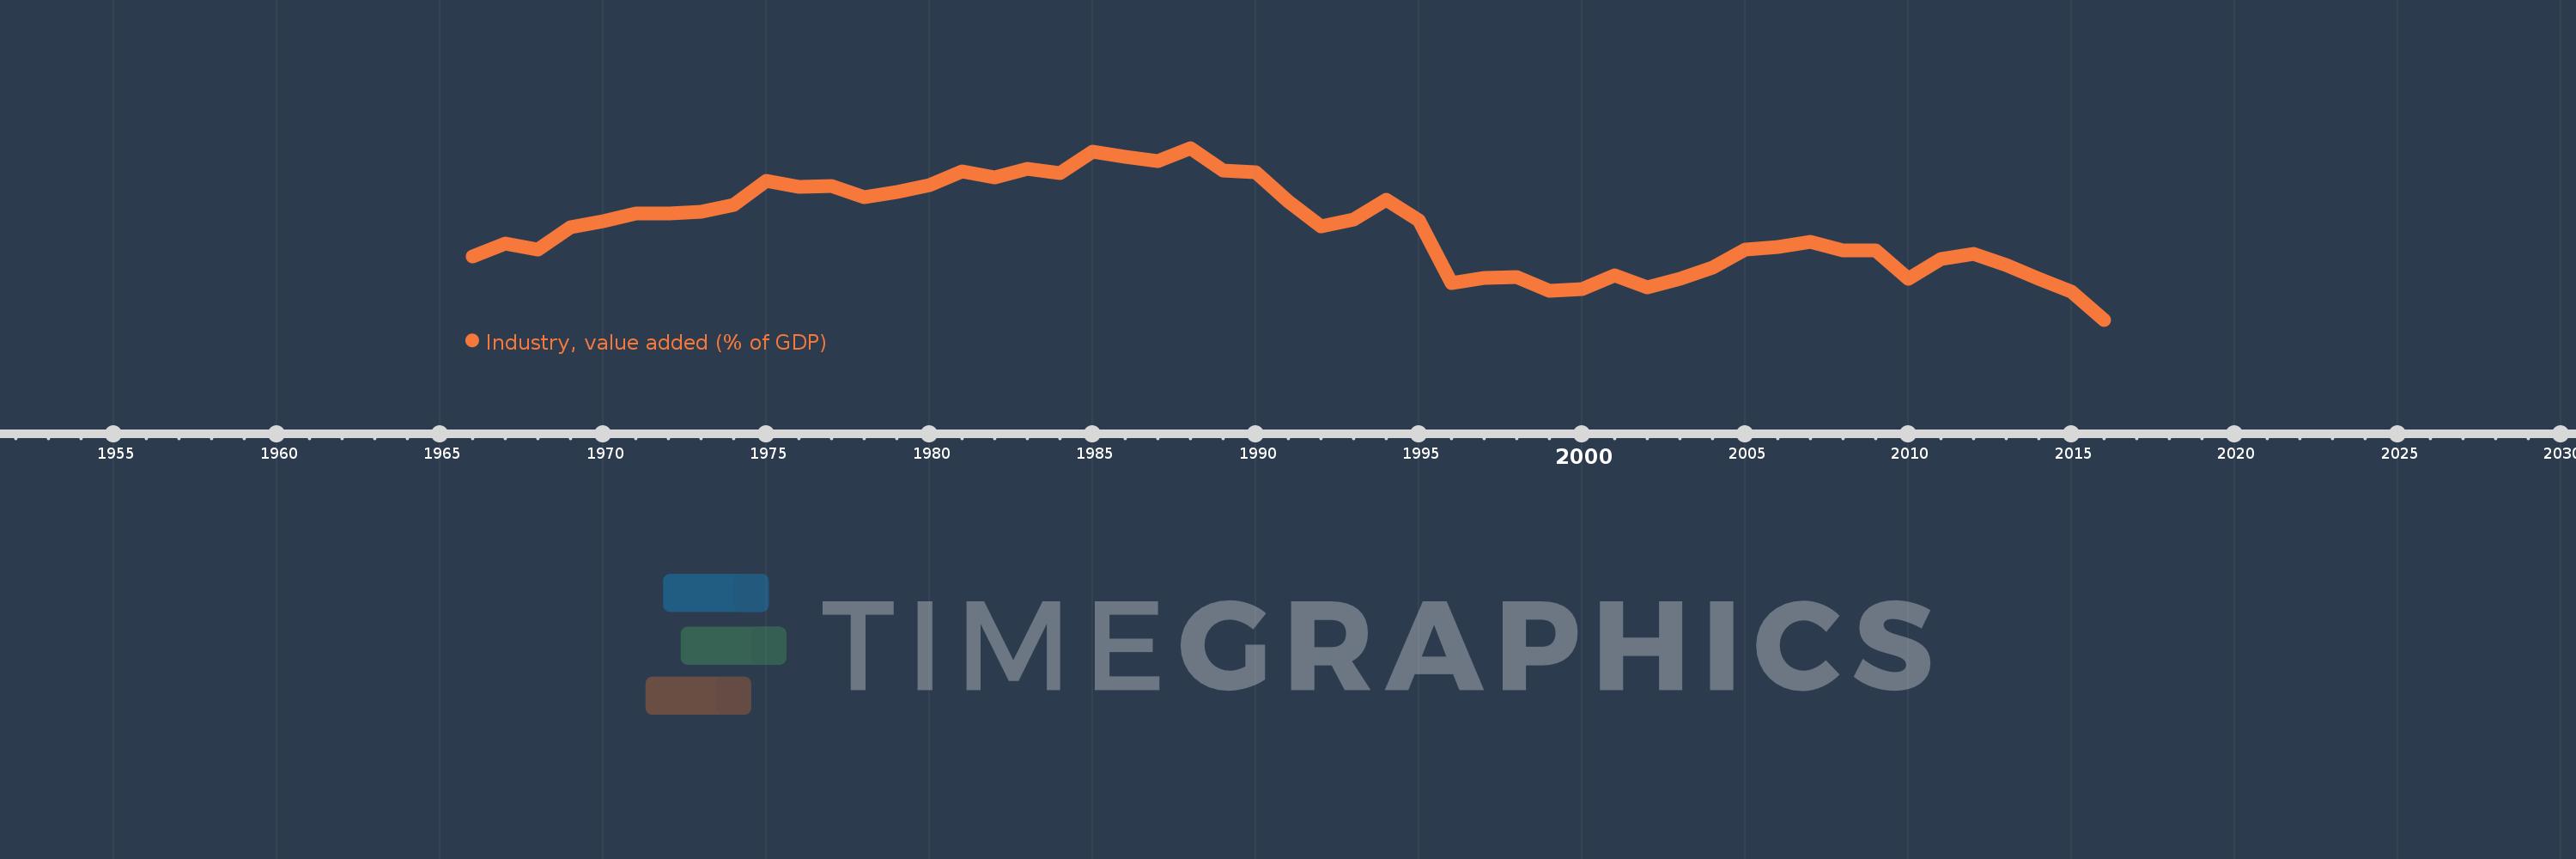
Industry, value added (% of GDP)
2016,2015,2014,2013,2012,2011,2010,2009,2008,2007,2006,2005,2004,2003,2002,2001,2000,1999,1998,1997,1996,1995,1994,1993,1992,1991,1990,1989,1988,1987,1986,1985,1984,1983,1982,1981,1980,1979,1978,1977,1976,1975,1974,1973,1972,1971,1970,1969,1968,1967,1966
Estas estadísticas en otros países:
AfghanistanAlbaniaAlgeriaAndorraAngolaAntigua and BarbudaArab WorldArgentinaArmeniaArubaAustraliaAustriaAzerbaijanBahamas, TheBahrainBangladeshBarbadosBelarusBelgiumBelizeBeninBermudaBhutanBoliviaBosnia and HerzegovinaBotswanaBrazilBrunei DarussalamBulgariaBurkina FasoBurundiCabo VerdeCambodiaCameroonCanadaCaribbean small statesCayman IslandsCentral African RepublicCentral Europe and the BalticsChadChileChinaColombiaComorosCongo, Dem. Rep.Congo, Rep.Costa RicaCote d'IvoireCroatiaCubaCyprusCzech RepublicDenmarkDjiboutiDominicaDominican RepublicEarly-demographic dividendEast Asia & PacificEast Asia & Pacific (excluding high income)East Asia & Pacific (IDA & IBRD countries)EcuadorEgypt, Arab Rep.El SalvadorEquatorial GuineaEritreaEstoniaEthiopiaEuro areaEurope & Central AsiaEurope & Central Asia (excluding high income)Europe & Central Asia (IDA & IBRD countries)European UnionFijiFinlandFragile and conflict affected situationsFranceGabonGambia, TheGeorgiaGermanyGhanaGreeceGrenadaGuatemalaGuineaGuinea-BissauGuyanaHeavily indebted poor countries (HIPC)High incomeHondurasHong Kong SAR, ChinaHungaryIBRD onlyIcelandIDA & IBRD totalIDA blendIDA onlyIDA totalIndiaIndonesiaIran, Islamic Rep.IrelandItalyJamaicaJapanJordanKazakhstanKenyaKiribatiKorea, Rep.KosovoKuwaitKyrgyz RepublicLao PDRLate-demographic dividendLatin America & Caribbean Latin America & Caribbean (excluding high income)Latin America & the Caribbean (IDA & IBRD countries)LatviaLeast developed countries: UN classificationLebanonLesothoLibyaLiechtensteinLithuaniaLow & middle incomeLow incomeLower middle incomeLuxembourgMacao SAR, ChinaMacedonia, FYRMadagascarMalawiMalaysiaMaldivesMaliMaltaMarshall IslandsMauritaniaMauritiusMexicoMicronesia, Fed. Sts.Middle East & North AfricaMiddle East & North Africa (excluding high income)Middle East & North Africa (IDA & IBRD countries)Middle incomeMoldovaMongoliaMontenegroMoroccoMozambiqueMyanmarNamibiaNepalNetherlandsNew CaledoniaNew ZealandNicaraguaNigerNigeriaNorth AmericaNorwayOECD membersOmanOther small statesPacific island small statesPakistanPalauPanamaPapua New GuineaParaguayPeruPhilippinesPolandPortugalPost-demographic dividendPre-demographic dividendPuerto RicoQatarRomaniaRussian FederationRwandaSao Tome and PrincipeSaudi ArabiaSenegalSerbiaSeychellesSierra LeoneSingaporeSlovak RepublicSloveniaSmall statesSolomon IslandsSomaliaSouth AfricaSouth AsiaSouth Asia (IDA & IBRD)SpainSri LankaSt. Kitts and NevisSt. LuciaSt. Vincent and the GrenadinesSub-Saharan Africa Sub-Saharan Africa (excluding high income)Sub-Saharan Africa (IDA & IBRD countries)SudanSurinameSwazilandSwedenSwitzerlandSyrian Arab RepublicTajikistanTanzaniaThailandTimor-LesteTogoTongaTrinidad and TobagoTunisiaTurkeyTurkmenistanTuvaluUgandaUkraineUnited KingdomUnited StatesUpper middle incomeUruguayUzbekistanVanuatuVenezuela, RBVietnamWest Bank and GazaWorldYemen, Rep.ZambiaZimbabwe línea de tiempo (timeline):
En esta escala de tiempo se presenta un gráfico de 1966 y 2016 de Latin America & the Caribbean (IDA & IBRD countries). Los datos de 1965 están ausentes. El número de observaciones reales por fecha: 51.
Fuente (nombre):
Indicadores del desarrollo mundial
Fuente (organización):
World Bank national accounts data, and OECD National Accounts data files.
Categorías:
Economy & Growth
Se ha actualizado:
23 abr 2017 año
Los indicadores de los cambios de valor en los últimos años
Mínimo:
27.578
1 ene 2016 año
Máximo:
41.61
1 ene 1988 año
A la fecha de observación
Valor
Cambio absoluto
El cambio con respecto al valor anterior
1 ene 1966 año
32.734
+32.734
0.0%
1 ene 1967 año
33.78
+1.046
3.2%
1 ene 1968 año
33.28
-0.499
-1.48%
1 ene 1969 año
35.154
+1.873
5.63%
1 ene 1970 año
35.605
+0.452
1.28%
1 ene 1971 año
36.238
+0.633
1.78%
1 ene 1972 año
36.285
+0.047
0.13%
1 ene 1973 año
36.38
+0.095
0.26%
1 ene 1974 año
36.955
+0.574
1.58%
1 ene 1975 año
38.91
+1.956
5.29%
1 ene 1976 año
38.463
-0.447
-1.15%
1 ene 1977 año
38.476
+0.013
0.03%
1 ene 1978 año
37.599
-0.877
-2.28%
1 ene 1979 año
37.994
+0.395
1.05%
1 ene 1980 año
38.596
+0.602
1.58%
1 ene 1981 año
39.722
+1.126
2.92%
1 ene 1982 año
39.209
-0.513
-1.29%
1 ene 1983 año
39.913
+0.704
1.8%
1 ene 1984 año
39.575
-0.338
-0.85%
1 ene 1985 año
41.33
+1.755
4.43%
1 ene 1986 año
40.917
-0.412
-1.0%
1 ene 1987 año
40.555
-0.362
-0.89%
1 ene 1988 año
41.61
+1.055
2.6%
1 ene 1989 año
39.796
-1.814
-4.36%
1 ene 1990 año
39.619
-0.177
-0.44%
1 ene 1991 año
37.254
-2.366
-5.97%
1 ene 1992 año
35.191
-2.062
-5.54%
1 ene 1993 año
35.738
+0.547
1.55%
1 ene 1994 año
37.369
+1.63
4.56%
1 ene 1995 año
35.696
-1.673
-4.48%
1 ene 1996 año
30.587
-5.109
-14.31%
1 ene 1997 año
30.993
+0.405
1.33%
1 ene 1998 año
31.074
+0.081
0.26%
1 ene 1999 año
29.94
-1.134
-3.65%
1 ene 2000 año
30.073
+0.134
0.45%
1 ene 2001 año
31.181
+1.108
3.68%
1 ene 2002 año
30.249
-0.932
-2.99%
1 ene 2003 año
30.932
+0.682
2.26%
1 ene 2004 año
31.821
+0.889
2.87%
1 ene 2005 año
33.339
+1.518
4.77%
1 ene 2006 año
33.524
+0.185
0.55%
1 ene 2007 año
33.95
+0.426
1.27%
1 ene 2008 año
33.218
-0.732
-2.16%
1 ene 2009 año
33.25
+0.032
0.1%
1 ene 2010 año
30.898
-2.352
-7.07%
1 ene 2011 año
32.554
+1.656
5.36%
1 ene 2012 año
32.97
+0.417
1.28%
1 ene 2013 año
32.075
-0.895
-2.72%
1 ene 2014 año
30.957
-1.118
-3.49%
1 ene 2015 año
29.866
-1.091
-3.52%
1 ene 2016 año
27.578
-2.288
-7.66%
Ranking de los países por los datos estadísticos actuales


Comentarios: