29
/es/
es
AIzaSyAYiBZKx7MnpbEhh9jyipgxe19OcubqV5w
April 1, 2024
113733
Cote d'Ivoire
CIV
true
2
1
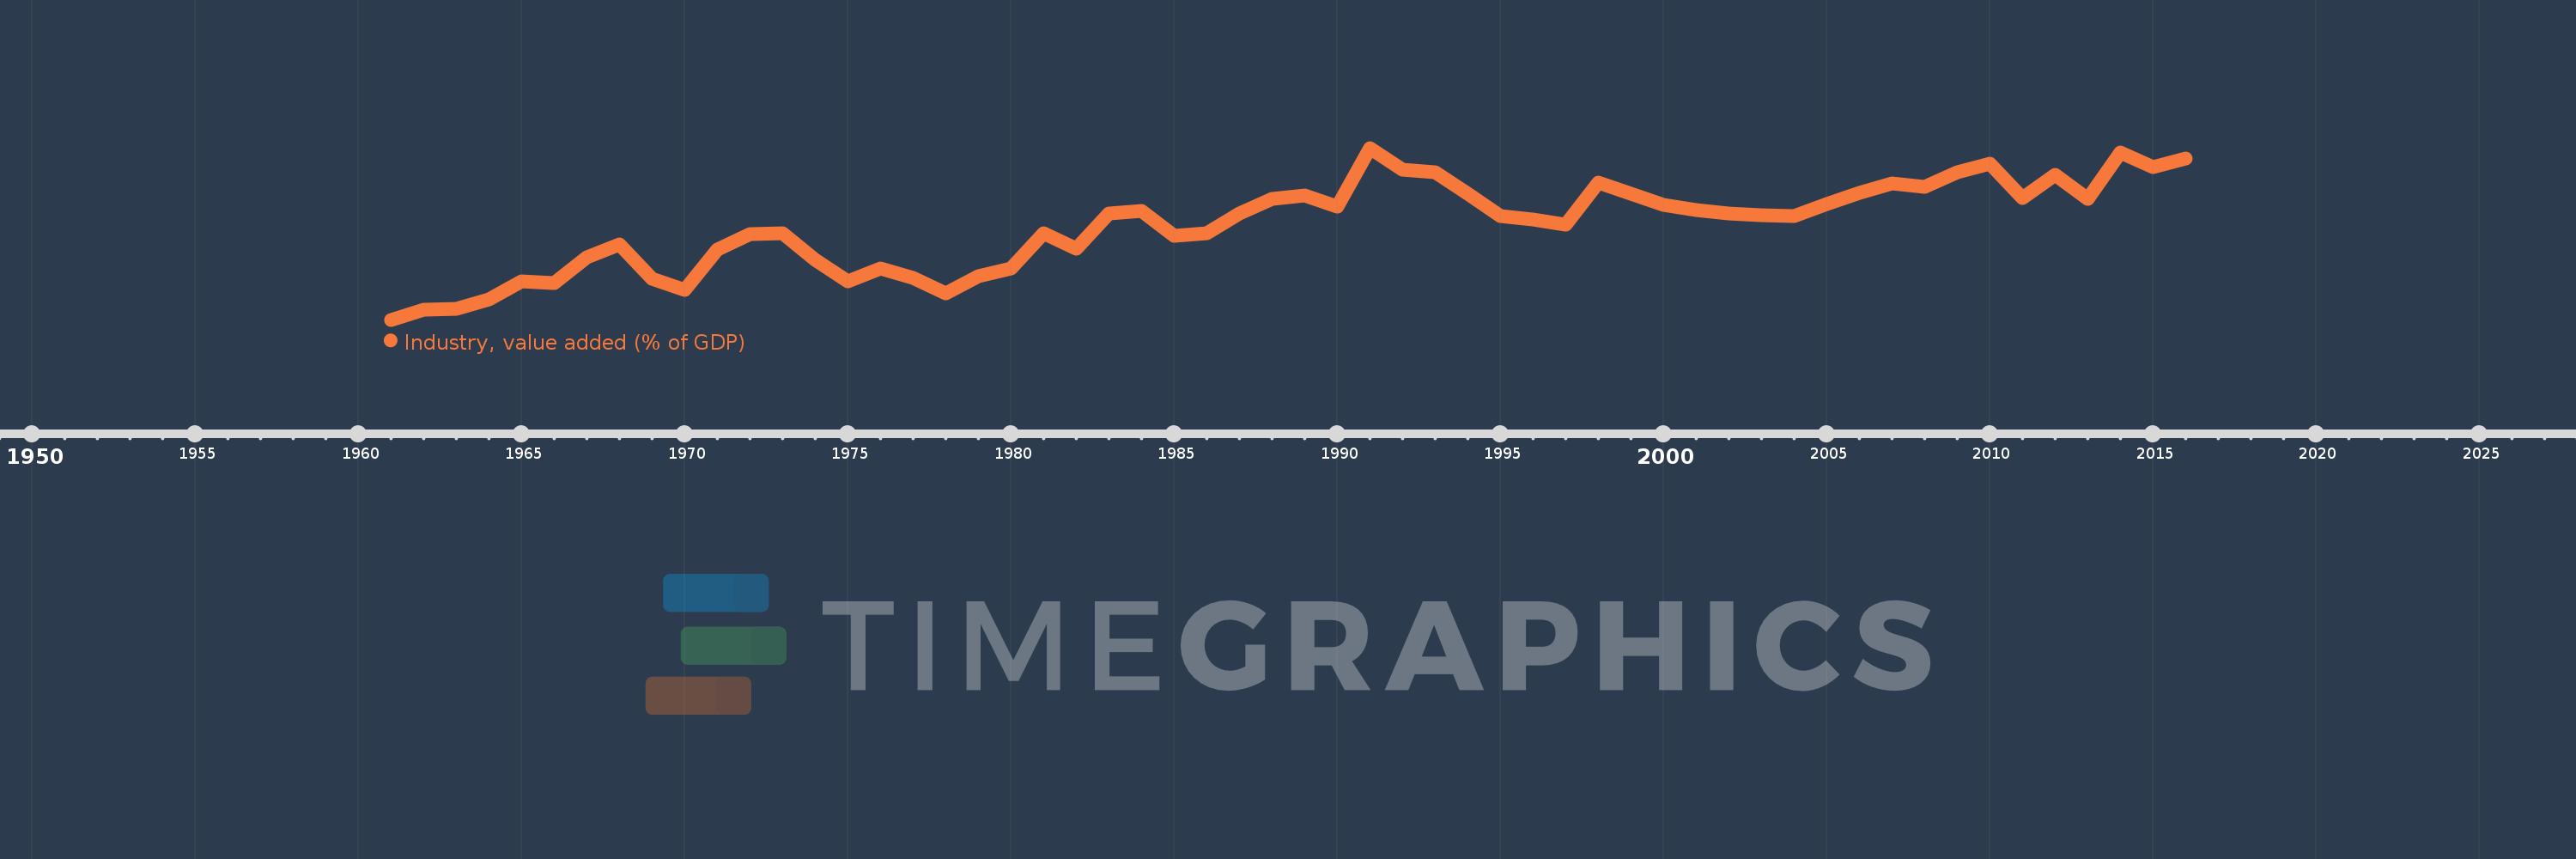
Industry, value added (% of GDP)
2016,2015,2014,2013,2012,2011,2010,2009,2008,2007,2006,2005,2004,2003,2002,2001,2000,1999,1998,1997,1996,1995,1994,1993,1992,1991,1990,1989,1988,1987,1986,1985,1984,1983,1982,1981,1980,1979,1978,1977,1976,1975,1974,1973,1972,1971,1970,1969,1968,1967,1966,1965,1964,1963,1962,1961
Estas estadísticas en otros países:
AfghanistanAlbaniaAlgeriaAndorraAngolaAntigua and BarbudaArab WorldArgentinaArmeniaArubaAustraliaAustriaAzerbaijanBahamas, TheBahrainBangladeshBarbadosBelarusBelgiumBelizeBeninBermudaBhutanBoliviaBosnia and HerzegovinaBotswanaBrazilBrunei DarussalamBulgariaBurkina FasoBurundiCabo VerdeCambodiaCameroonCanadaCaribbean small statesCayman IslandsCentral African RepublicCentral Europe and the BalticsChadChileChinaColombiaComorosCongo, Dem. Rep.Congo, Rep.Costa RicaCote d'IvoireCroatiaCubaCyprusCzech RepublicDenmarkDjiboutiDominicaDominican RepublicEarly-demographic dividendEast Asia & PacificEast Asia & Pacific (excluding high income)East Asia & Pacific (IDA & IBRD countries)EcuadorEgypt, Arab Rep.El SalvadorEquatorial GuineaEritreaEstoniaEthiopiaEuro areaEurope & Central AsiaEurope & Central Asia (excluding high income)Europe & Central Asia (IDA & IBRD countries)European UnionFijiFinlandFragile and conflict affected situationsFranceGabonGambia, TheGeorgiaGermanyGhanaGreeceGrenadaGuatemalaGuineaGuinea-BissauGuyanaHeavily indebted poor countries (HIPC)High incomeHondurasHong Kong SAR, ChinaHungaryIBRD onlyIcelandIDA & IBRD totalIDA blendIDA onlyIDA totalIndiaIndonesiaIran, Islamic Rep.IrelandItalyJamaicaJapanJordanKazakhstanKenyaKiribatiKorea, Rep.KosovoKuwaitKyrgyz RepublicLao PDRLate-demographic dividendLatin America & Caribbean Latin America & Caribbean (excluding high income)Latin America & the Caribbean (IDA & IBRD countries)LatviaLeast developed countries: UN classificationLebanonLesothoLibyaLiechtensteinLithuaniaLow & middle incomeLow incomeLower middle incomeLuxembourgMacao SAR, ChinaMacedonia, FYRMadagascarMalawiMalaysiaMaldivesMaliMaltaMarshall IslandsMauritaniaMauritiusMexicoMicronesia, Fed. Sts.Middle East & North AfricaMiddle East & North Africa (excluding high income)Middle East & North Africa (IDA & IBRD countries)Middle incomeMoldovaMongoliaMontenegroMoroccoMozambiqueMyanmarNamibiaNepalNetherlandsNew CaledoniaNew ZealandNicaraguaNigerNigeriaNorth AmericaNorwayOECD membersOmanOther small statesPacific island small statesPakistanPalauPanamaPapua New GuineaParaguayPeruPhilippinesPolandPortugalPost-demographic dividendPre-demographic dividendPuerto RicoQatarRomaniaRussian FederationRwandaSao Tome and PrincipeSaudi ArabiaSenegalSerbiaSeychellesSierra LeoneSingaporeSlovak RepublicSloveniaSmall statesSolomon IslandsSomaliaSouth AfricaSouth AsiaSouth Asia (IDA & IBRD)SpainSri LankaSt. Kitts and NevisSt. LuciaSt. Vincent and the GrenadinesSub-Saharan Africa Sub-Saharan Africa (excluding high income)Sub-Saharan Africa (IDA & IBRD countries)SudanSurinameSwazilandSwedenSwitzerlandSyrian Arab RepublicTajikistanTanzaniaThailandTimor-LesteTogoTongaTrinidad and TobagoTunisiaTurkeyTurkmenistanTuvaluUgandaUkraineUnited KingdomUnited StatesUpper middle incomeUruguayUzbekistanVanuatuVenezuela, RBVietnamWest Bank and GazaWorldYemen, Rep.ZambiaZimbabwe línea de tiempo (timeline):
En esta escala de tiempo se presenta un gráfico de 1961 y 2016 de Cote d'Ivoire. Los datos de 1960 están ausentes. El número de observaciones reales por fecha: 56.
Fuente (nombre):
Indicadores del desarrollo mundial
Fuente (organización):
World Bank national accounts data, and OECD National Accounts data files.
Categorías:
Economy & Growth
Se ha actualizado:
23 abr 2017 año
Los indicadores de los cambios de valor en los últimos años
Mínimo:
13.139
1 ene 1961 año
Máximo:
26.267
1 ene 1991 año
A la fecha de observación
Valor
Cambio absoluto
El cambio con respecto al valor anterior
1 ene 1961 año
13.139
+13.139
0.0%
1 ene 1962 año
13.879
+0.74
5.63%
1 ene 1963 año
13.982
+0.103
0.74%
1 ene 1964 año
14.7
+0.718
5.14%
1 ene 1965 año
16.064
+1.364
9.28%
1 ene 1966 año
15.927
-0.137
-0.85%
1 ene 1967 año
17.886
+1.958
12.3%
1 ene 1968 año
18.881
+0.996
5.57%
1 ene 1969 año
16.299
-2.583
-13.68%
1 ene 1970 año
15.428
-0.871
-5.34%
1 ene 1971 año
18.494
+3.066
19.87%
1 ene 1972 año
19.693
+1.199
6.48%
1 ene 1973 año
19.738
+0.045
0.23%
1 ene 1974 año
17.743
-1.995
-10.11%
1 ene 1975 año
16.089
-1.653
-9.32%
1 ene 1976 año
17.04
+0.951
5.91%
1 ene 1977 año
16.364
-0.676
-3.97%
1 ene 1978 año
15.157
-1.207
-7.38%
1 ene 1979 año
16.48
+1.322
8.73%
1 ene 1980 año
17.06
+0.58
3.52%
1 ene 1981 año
19.74
+2.68
15.71%
1 ene 1982 año
18.588
-1.152
-5.84%
1 ene 1983 año
21.288
+2.7
14.53%
1 ene 1984 año
21.481
+0.192
0.9%
1 ene 1985 año
19.548
-1.932
-9.0%
1 ene 1986 año
19.746
+0.198
1.01%
1 ene 1987 año
21.282
+1.536
7.78%
1 ene 1988 año
22.365
+1.082
5.09%
1 ene 1989 año
22.651
+0.286
1.28%
1 ene 1990 año
21.784
-0.867
-3.83%
1 ene 1991 año
26.267
+4.484
20.58%
1 ene 1992 año
24.598
-1.669
-6.35%
1 ene 1993 año
24.442
-0.156
-0.64%
1 ene 1994 año
22.754
-1.688
-6.91%
1 ene 1995 año
21.04
-1.714
-7.53%
1 ene 1996 año
20.768
-0.272
-1.29%
1 ene 1997 año
20.418
-0.35
-1.68%
1 ene 1998 año
23.65
+3.232
15.83%
1 ene 1999 año
22.778
-0.872
-3.69%
1 ene 2000 año
21.906
-0.871
-3.83%
1 ene 2001 año
21.504
-0.402
-1.83%
1 ene 2002 año
21.277
-0.228
-1.06%
1 ene 2003 año
21.104
-0.173
-0.81%
1 ene 2004 año
21.074
-0.03
-0.14%
1 ene 2005 año
22.011
+0.937
4.45%
1 ene 2006 año
22.817
+0.806
3.66%
1 ene 2007 año
23.532
+0.715
3.14%
1 ene 2008 año
23.272
-0.26
-1.11%
1 ene 2009 año
24.391
+1.119
4.81%
1 ene 2010 año
25.047
+0.656
2.69%
1 ene 2011 año
22.408
-2.638
-10.53%
1 ene 2012 año
24.214
+1.806
8.06%
1 ene 2013 año
22.343
-1.872
-7.73%
1 ene 2014 año
25.951
+3.608
16.15%
1 ene 2015 año
24.804
-1.147
-4.42%
1 ene 2016 año
25.479
+0.675
2.72%
Ranking de los países por los datos estadísticos actuales


Comentarios: