29
/es/
es
AIzaSyAYiBZKx7MnpbEhh9jyipgxe19OcubqV5w
April 1, 2024
138172
Georgia
GEO
true
2
1
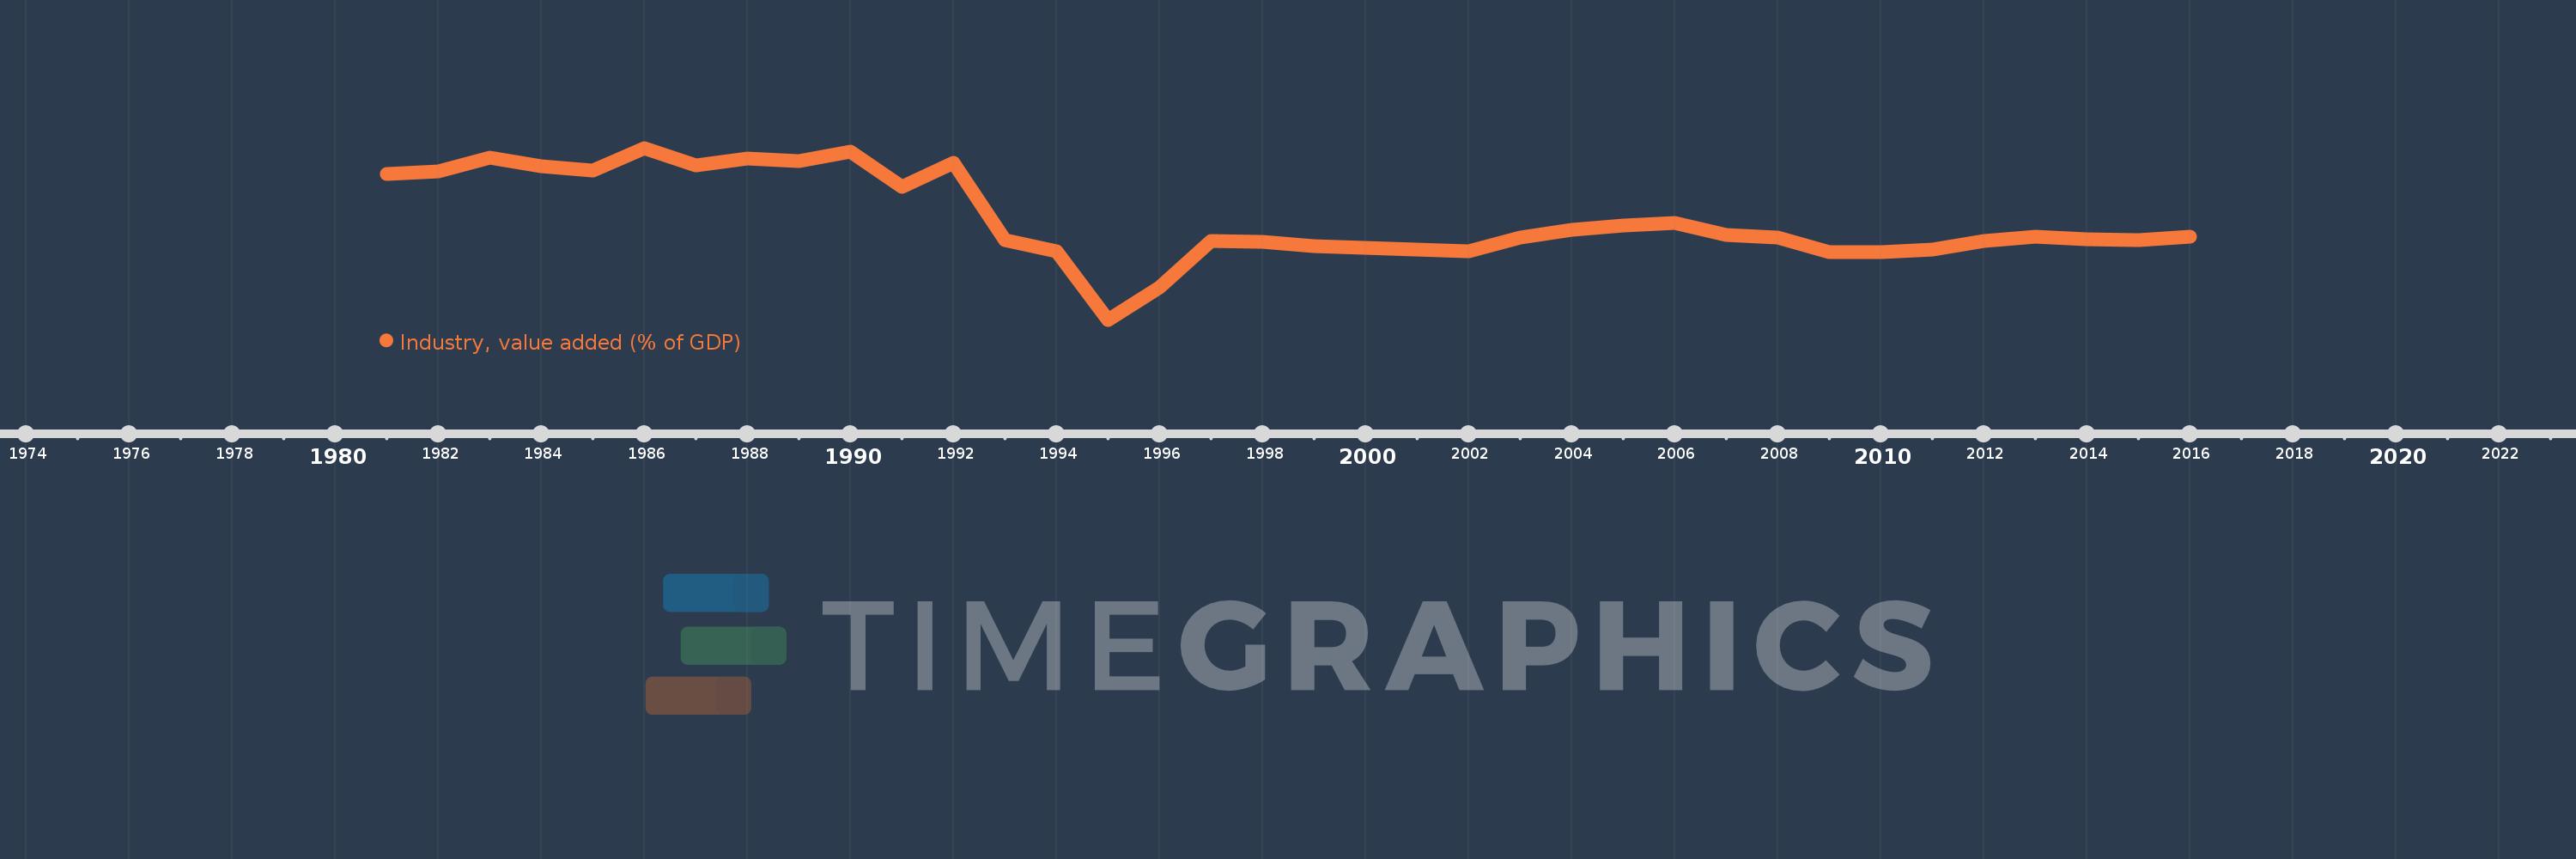
Industry, value added (% of GDP)
2016,2015,2014,2013,2012,2011,2010,2009,2008,2007,2006,2005,2004,2003,2002,2001,2000,1999,1998,1997,1996,1995,1994,1993,1992,1991,1990,1989,1988,1987,1986,1985,1984,1983,1982,1981
Estas estadísticas en otros países:
AfghanistanAlbaniaAlgeriaAndorraAngolaAntigua and BarbudaArab WorldArgentinaArmeniaArubaAustraliaAustriaAzerbaijanBahamas, TheBahrainBangladeshBarbadosBelarusBelgiumBelizeBeninBermudaBhutanBoliviaBosnia and HerzegovinaBotswanaBrazilBrunei DarussalamBulgariaBurkina FasoBurundiCabo VerdeCambodiaCameroonCanadaCaribbean small statesCayman IslandsCentral African RepublicCentral Europe and the BalticsChadChileChinaColombiaComorosCongo, Dem. Rep.Congo, Rep.Costa RicaCote d'IvoireCroatiaCubaCyprusCzech RepublicDenmarkDjiboutiDominicaDominican RepublicEarly-demographic dividendEast Asia & PacificEast Asia & Pacific (excluding high income)East Asia & Pacific (IDA & IBRD countries)EcuadorEgypt, Arab Rep.El SalvadorEquatorial GuineaEritreaEstoniaEthiopiaEuro areaEurope & Central AsiaEurope & Central Asia (excluding high income)Europe & Central Asia (IDA & IBRD countries)European UnionFijiFinlandFragile and conflict affected situationsFranceGabonGambia, TheGeorgiaGermanyGhanaGreeceGrenadaGuatemalaGuineaGuinea-BissauGuyanaHeavily indebted poor countries (HIPC)High incomeHondurasHong Kong SAR, ChinaHungaryIBRD onlyIcelandIDA & IBRD totalIDA blendIDA onlyIDA totalIndiaIndonesiaIran, Islamic Rep.IrelandItalyJamaicaJapanJordanKazakhstanKenyaKiribatiKorea, Rep.KosovoKuwaitKyrgyz RepublicLao PDRLate-demographic dividendLatin America & Caribbean Latin America & Caribbean (excluding high income)Latin America & the Caribbean (IDA & IBRD countries)LatviaLeast developed countries: UN classificationLebanonLesothoLibyaLiechtensteinLithuaniaLow & middle incomeLow incomeLower middle incomeLuxembourgMacao SAR, ChinaMacedonia, FYRMadagascarMalawiMalaysiaMaldivesMaliMaltaMarshall IslandsMauritaniaMauritiusMexicoMicronesia, Fed. Sts.Middle East & North AfricaMiddle East & North Africa (excluding high income)Middle East & North Africa (IDA & IBRD countries)Middle incomeMoldovaMongoliaMontenegroMoroccoMozambiqueMyanmarNamibiaNepalNetherlandsNew CaledoniaNew ZealandNicaraguaNigerNigeriaNorth AmericaNorwayOECD membersOmanOther small statesPacific island small statesPakistanPalauPanamaPapua New GuineaParaguayPeruPhilippinesPolandPortugalPost-demographic dividendPre-demographic dividendPuerto RicoQatarRomaniaRussian FederationRwandaSao Tome and PrincipeSaudi ArabiaSenegalSerbiaSeychellesSierra LeoneSingaporeSlovak RepublicSloveniaSmall statesSolomon IslandsSomaliaSouth AfricaSouth AsiaSouth Asia (IDA & IBRD)SpainSri LankaSt. Kitts and NevisSt. LuciaSt. Vincent and the GrenadinesSub-Saharan Africa Sub-Saharan Africa (excluding high income)Sub-Saharan Africa (IDA & IBRD countries)SudanSurinameSwazilandSwedenSwitzerlandSyrian Arab RepublicTajikistanTanzaniaThailandTimor-LesteTogoTongaTrinidad and TobagoTunisiaTurkeyTurkmenistanTuvaluUgandaUkraineUnited KingdomUnited StatesUpper middle incomeUruguayUzbekistanVanuatuVenezuela, RBVietnamWest Bank and GazaWorldYemen, Rep.ZambiaZimbabwe línea de tiempo (timeline):
En esta escala de tiempo se presenta un gráfico de 1981 y 2016 de Georgia. Los datos de 1980 están ausentes. El número de observaciones reales por fecha: 36.
Fuente (nombre):
Indicadores del desarrollo mundial
Fuente (organización):
World Bank national accounts data, and OECD National Accounts data files.
Categorías:
Economy & Growth
Se ha actualizado:
23 abr 2017 año
Los indicadores de los cambios de valor en los últimos años
Mínimo:
10.29
1 ene 1995 año
Máximo:
39.695
1 ene 1986 año
A la fecha de observación
Valor
Cambio absoluto
El cambio con respecto al valor anterior
1 ene 1981 año
35.238
+35.238
0.0%
1 ene 1982 año
35.652
+0.414
1.18%
1 ene 1983 año
38.017
+2.364
6.63%
1 ene 1984 año
36.585
-1.431
-3.76%
1 ene 1985 año
35.878
-0.708
-1.93%
1 ene 1986 año
39.695
+3.817
10.64%
1 ene 1987 año
36.719
-2.976
-7.5%
1 ene 1988 año
37.879
+1.16
3.16%
1 ene 1989 año
37.5
-0.379
-1.0%
1 ene 1990 año
39.098
+1.598
4.26%
1 ene 1991 año
33.099
-5.999
-15.34%
1 ene 1992 año
37.079
+3.98
12.02%
1 ene 1993 año
23.916
-13.163
-35.5%
1 ene 1994 año
21.991
-1.925
-8.05%
1 ene 1995 año
10.29
-11.701
-53.21%
1 ene 1996 año
15.78
+5.49
53.35%
1 ene 1997 año
23.728
+7.949
50.37%
1 ene 1998 año
23.619
-0.109
-0.46%
1 ene 1999 año
22.894
-0.725
-3.07%
1 ene 2000 año
22.529
-0.365
-1.59%
1 ene 2001 año
22.355
-0.174
-0.77%
1 ene 2002 año
21.971
-0.384
-1.72%
1 ene 2003 año
24.355
+2.384
10.85%
1 ene 2004 año
25.649
+1.294
5.31%
1 ene 2005 año
26.421
+0.772
3.01%
1 ene 2006 año
26.846
+0.425
1.61%
1 ene 2007 año
24.856
-1.99
-7.41%
1 ene 2008 año
24.309
-0.547
-2.2%
1 ene 2009 año
21.871
-2.438
-10.03%
1 ene 2010 año
21.897
+0.025
0.12%
1 ene 2011 año
22.243
+0.346
1.58%
1 ene 2012 año
23.804
+1.561
7.02%
1 ene 2013 año
24.502
+0.698
2.93%
1 ene 2014 año
24.021
-0.481
-1.96%
1 ene 2015 año
23.973
-0.048
-0.2%
1 ene 2016 año
24.521
+0.547
2.28%
Ranking de los países por los datos estadísticos actuales


Comentarios: