29
/es/
es
AIzaSyAYiBZKx7MnpbEhh9jyipgxe19OcubqV5w
April 1, 2024
240574
Singapore
SGP
true
2
1
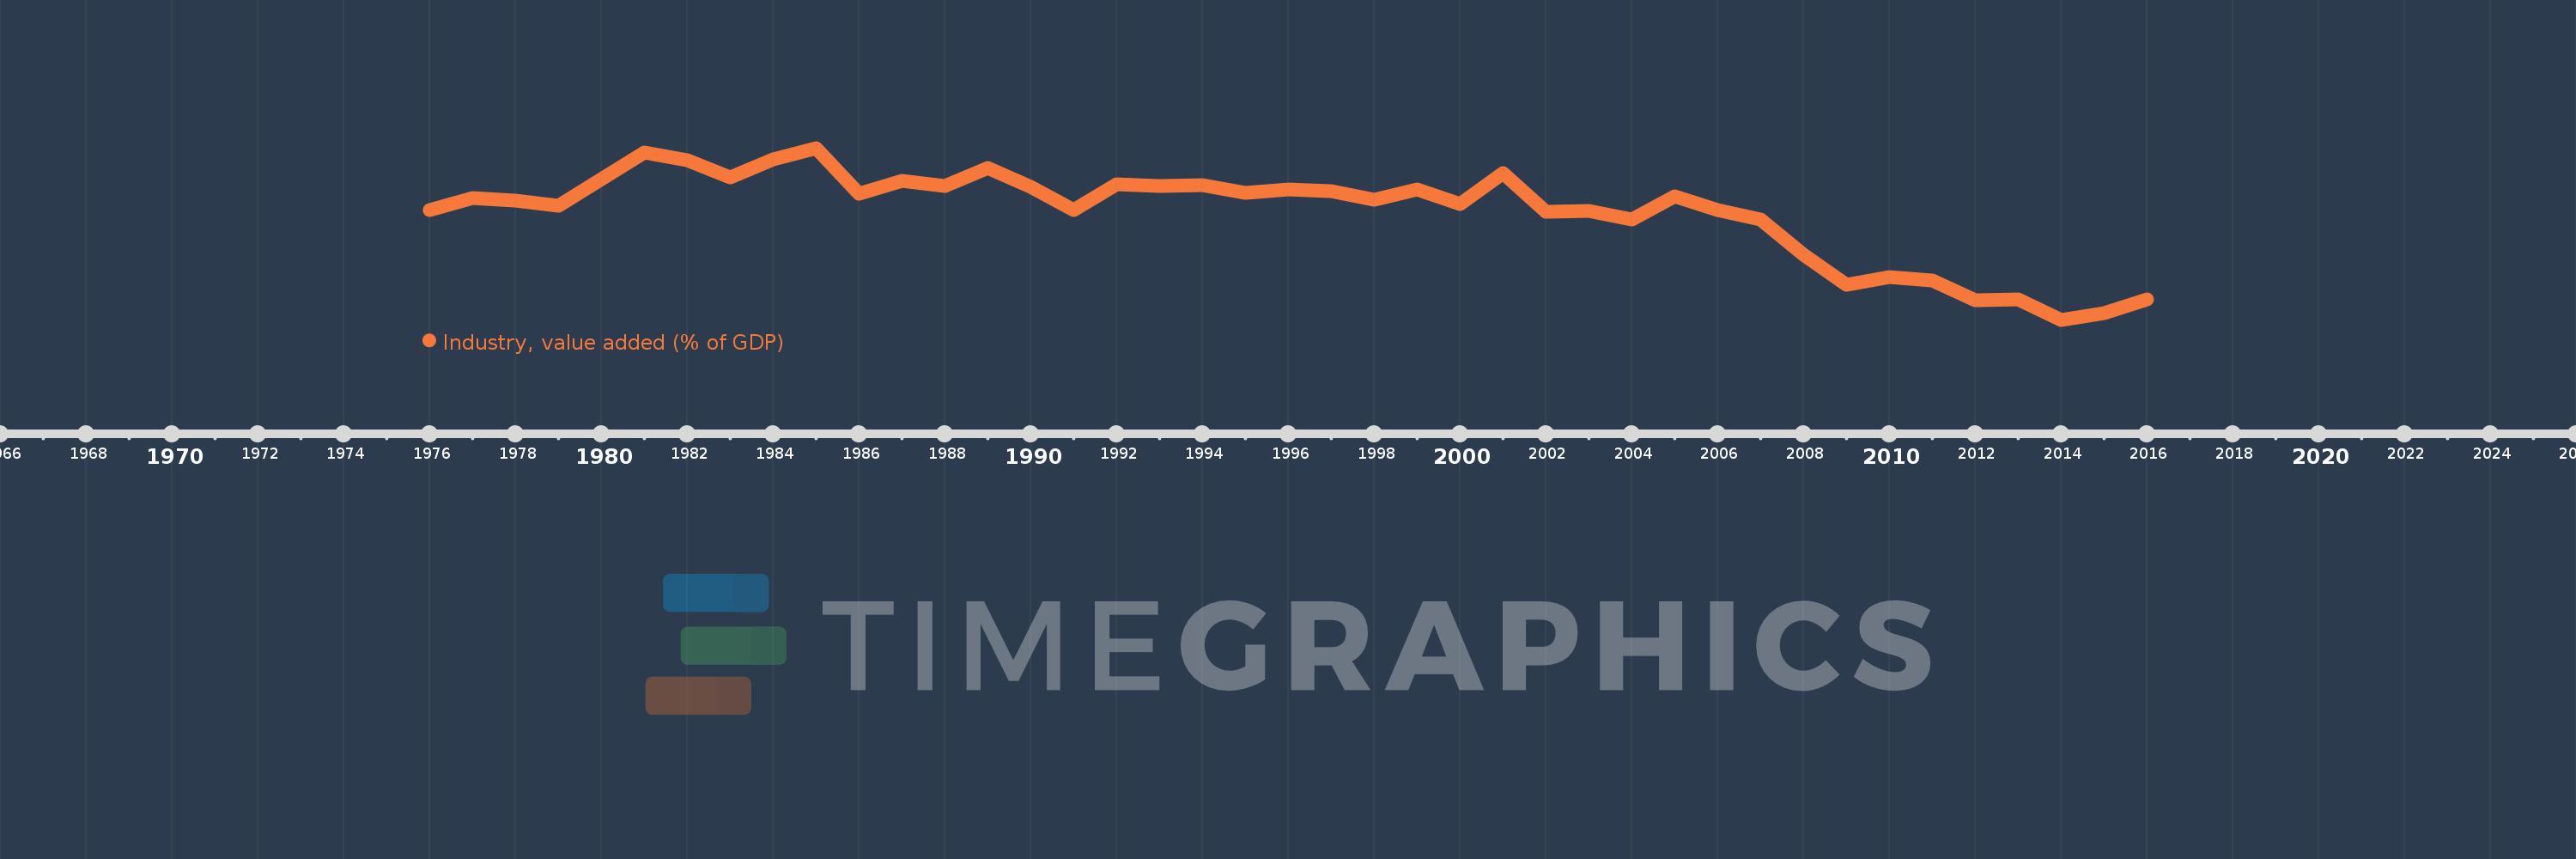
Industry, value added (% of GDP)
2016,2015,2014,2013,2012,2011,2010,2009,2008,2007,2006,2005,2004,2003,2002,2001,2000,1999,1998,1997,1996,1995,1994,1993,1992,1991,1990,1989,1988,1987,1986,1985,1984,1983,1982,1981,1980,1979,1978,1977,1976
Estas estadísticas en otros países:
AfghanistanAlbaniaAlgeriaAndorraAngolaAntigua and BarbudaArab WorldArgentinaArmeniaArubaAustraliaAustriaAzerbaijanBahamas, TheBahrainBangladeshBarbadosBelarusBelgiumBelizeBeninBermudaBhutanBoliviaBosnia and HerzegovinaBotswanaBrazilBrunei DarussalamBulgariaBurkina FasoBurundiCabo VerdeCambodiaCameroonCanadaCaribbean small statesCayman IslandsCentral African RepublicCentral Europe and the BalticsChadChileChinaColombiaComorosCongo, Dem. Rep.Congo, Rep.Costa RicaCote d'IvoireCroatiaCubaCyprusCzech RepublicDenmarkDjiboutiDominicaDominican RepublicEarly-demographic dividendEast Asia & PacificEast Asia & Pacific (excluding high income)East Asia & Pacific (IDA & IBRD countries)EcuadorEgypt, Arab Rep.El SalvadorEquatorial GuineaEritreaEstoniaEthiopiaEuro areaEurope & Central AsiaEurope & Central Asia (excluding high income)Europe & Central Asia (IDA & IBRD countries)European UnionFijiFinlandFragile and conflict affected situationsFranceGabonGambia, TheGeorgiaGermanyGhanaGreeceGrenadaGuatemalaGuineaGuinea-BissauGuyanaHeavily indebted poor countries (HIPC)High incomeHondurasHong Kong SAR, ChinaHungaryIBRD onlyIcelandIDA & IBRD totalIDA blendIDA onlyIDA totalIndiaIndonesiaIran, Islamic Rep.IrelandItalyJamaicaJapanJordanKazakhstanKenyaKiribatiKorea, Rep.KosovoKuwaitKyrgyz RepublicLao PDRLate-demographic dividendLatin America & Caribbean Latin America & Caribbean (excluding high income)Latin America & the Caribbean (IDA & IBRD countries)LatviaLeast developed countries: UN classificationLebanonLesothoLibyaLiechtensteinLithuaniaLow & middle incomeLow incomeLower middle incomeLuxembourgMacao SAR, ChinaMacedonia, FYRMadagascarMalawiMalaysiaMaldivesMaliMaltaMarshall IslandsMauritaniaMauritiusMexicoMicronesia, Fed. Sts.Middle East & North AfricaMiddle East & North Africa (excluding high income)Middle East & North Africa (IDA & IBRD countries)Middle incomeMoldovaMongoliaMontenegroMoroccoMozambiqueMyanmarNamibiaNepalNetherlandsNew CaledoniaNew ZealandNicaraguaNigerNigeriaNorth AmericaNorwayOECD membersOmanOther small statesPacific island small statesPakistanPalauPanamaPapua New GuineaParaguayPeruPhilippinesPolandPortugalPost-demographic dividendPre-demographic dividendPuerto RicoQatarRomaniaRussian FederationRwandaSao Tome and PrincipeSaudi ArabiaSenegalSerbiaSeychellesSierra LeoneSingaporeSlovak RepublicSloveniaSmall statesSolomon IslandsSomaliaSouth AfricaSouth AsiaSouth Asia (IDA & IBRD)SpainSri LankaSt. Kitts and NevisSt. LuciaSt. Vincent and the GrenadinesSub-Saharan Africa Sub-Saharan Africa (excluding high income)Sub-Saharan Africa (IDA & IBRD countries)SudanSurinameSwazilandSwedenSwitzerlandSyrian Arab RepublicTajikistanTanzaniaThailandTimor-LesteTogoTongaTrinidad and TobagoTunisiaTurkeyTurkmenistanTuvaluUgandaUkraineUnited KingdomUnited StatesUpper middle incomeUruguayUzbekistanVanuatuVenezuela, RBVietnamWest Bank and GazaWorldYemen, Rep.ZambiaZimbabwe línea de tiempo (timeline):
En esta escala de tiempo se presenta un gráfico de 1976 y 2016 de Singapore. Los datos de 1975 están ausentes. El número de observaciones reales por fecha: 41.
Fuente (nombre):
Indicadores del desarrollo mundial
Fuente (organización):
World Bank national accounts data, and OECD National Accounts data files.
Categorías:
Economy & Growth
Se ha actualizado:
23 abr 2017 año
Los indicadores de los cambios de valor en los últimos años
Mínimo:
25.009
1 ene 2014 año
Máximo:
36.534
1 ene 1985 año
A la fecha de observación
Valor
Cambio absoluto
El cambio con respecto al valor anterior
1 ene 1976 año
32.356
+32.356
0.0%
1 ene 1977 año
33.161
+0.805
2.49%
1 ene 1978 año
32.974
-0.187
-0.56%
1 ene 1979 año
32.636
-0.338
-1.03%
1 ene 1980 año
34.418
+1.782
5.46%
1 ene 1981 año
36.227
+1.809
5.26%
1 ene 1982 año
35.718
-0.509
-1.4%
1 ene 1983 año
34.548
-1.17
-3.28%
1 ene 1984 año
35.761
+1.213
3.51%
1 ene 1985 año
36.534
+0.773
2.16%
1 ene 1986 año
33.443
-3.091
-8.46%
1 ene 1987 año
34.355
+0.912
2.73%
1 ene 1988 año
33.98
-0.375
-1.09%
1 ene 1989 año
35.168
+1.188
3.5%
1 ene 1990 año
33.895
-1.273
-3.62%
1 ene 1991 año
32.34
-1.554
-4.59%
1 ene 1992 año
34.068
+1.727
5.34%
1 ene 1993 año
33.982
-0.086
-0.25%
1 ene 1994 año
34.053
+0.072
0.21%
1 ene 1995 año
33.533
-0.52
-1.53%
1 ene 1996 año
33.754
+0.221
0.66%
1 ene 1997 año
33.626
-0.129
-0.38%
1 ene 1998 año
33.088
-0.538
-1.6%
1 ene 1999 año
33.764
+0.677
2.04%
1 ene 2000 año
32.785
-0.979
-2.9%
1 ene 2001 año
34.834
+2.049
6.25%
1 ene 2002 año
32.28
-2.554
-7.33%
1 ene 2003 año
32.319
+0.039
0.12%
1 ene 2004 año
31.76
-0.559
-1.73%
1 ene 2005 año
33.274
+1.514
4.77%
1 ene 2006 año
32.362
-0.913
-2.74%
1 ene 2007 año
31.714
-0.648
-2.0%
1 ene 2008 año
29.349
-2.365
-7.46%
1 ene 2009 año
27.327
-2.022
-6.89%
1 ene 2010 año
27.868
+0.541
1.98%
1 ene 2011 año
27.629
-0.238
-0.86%
1 ene 2012 año
26.303
-1.326
-4.8%
1 ene 2013 año
26.392
+0.088
0.34%
1 ene 2014 año
25.009
-1.383
-5.24%
1 ene 2015 año
25.458
+0.449
1.8%
1 ene 2016 año
26.401
+0.943
3.7%
Ranking de los países por los datos estadísticos actuales


Comentarios: