29
/es/
es
AIzaSyAYiBZKx7MnpbEhh9jyipgxe19OcubqV5w
April 1, 2024
211851
Niger
NER
true
2
1
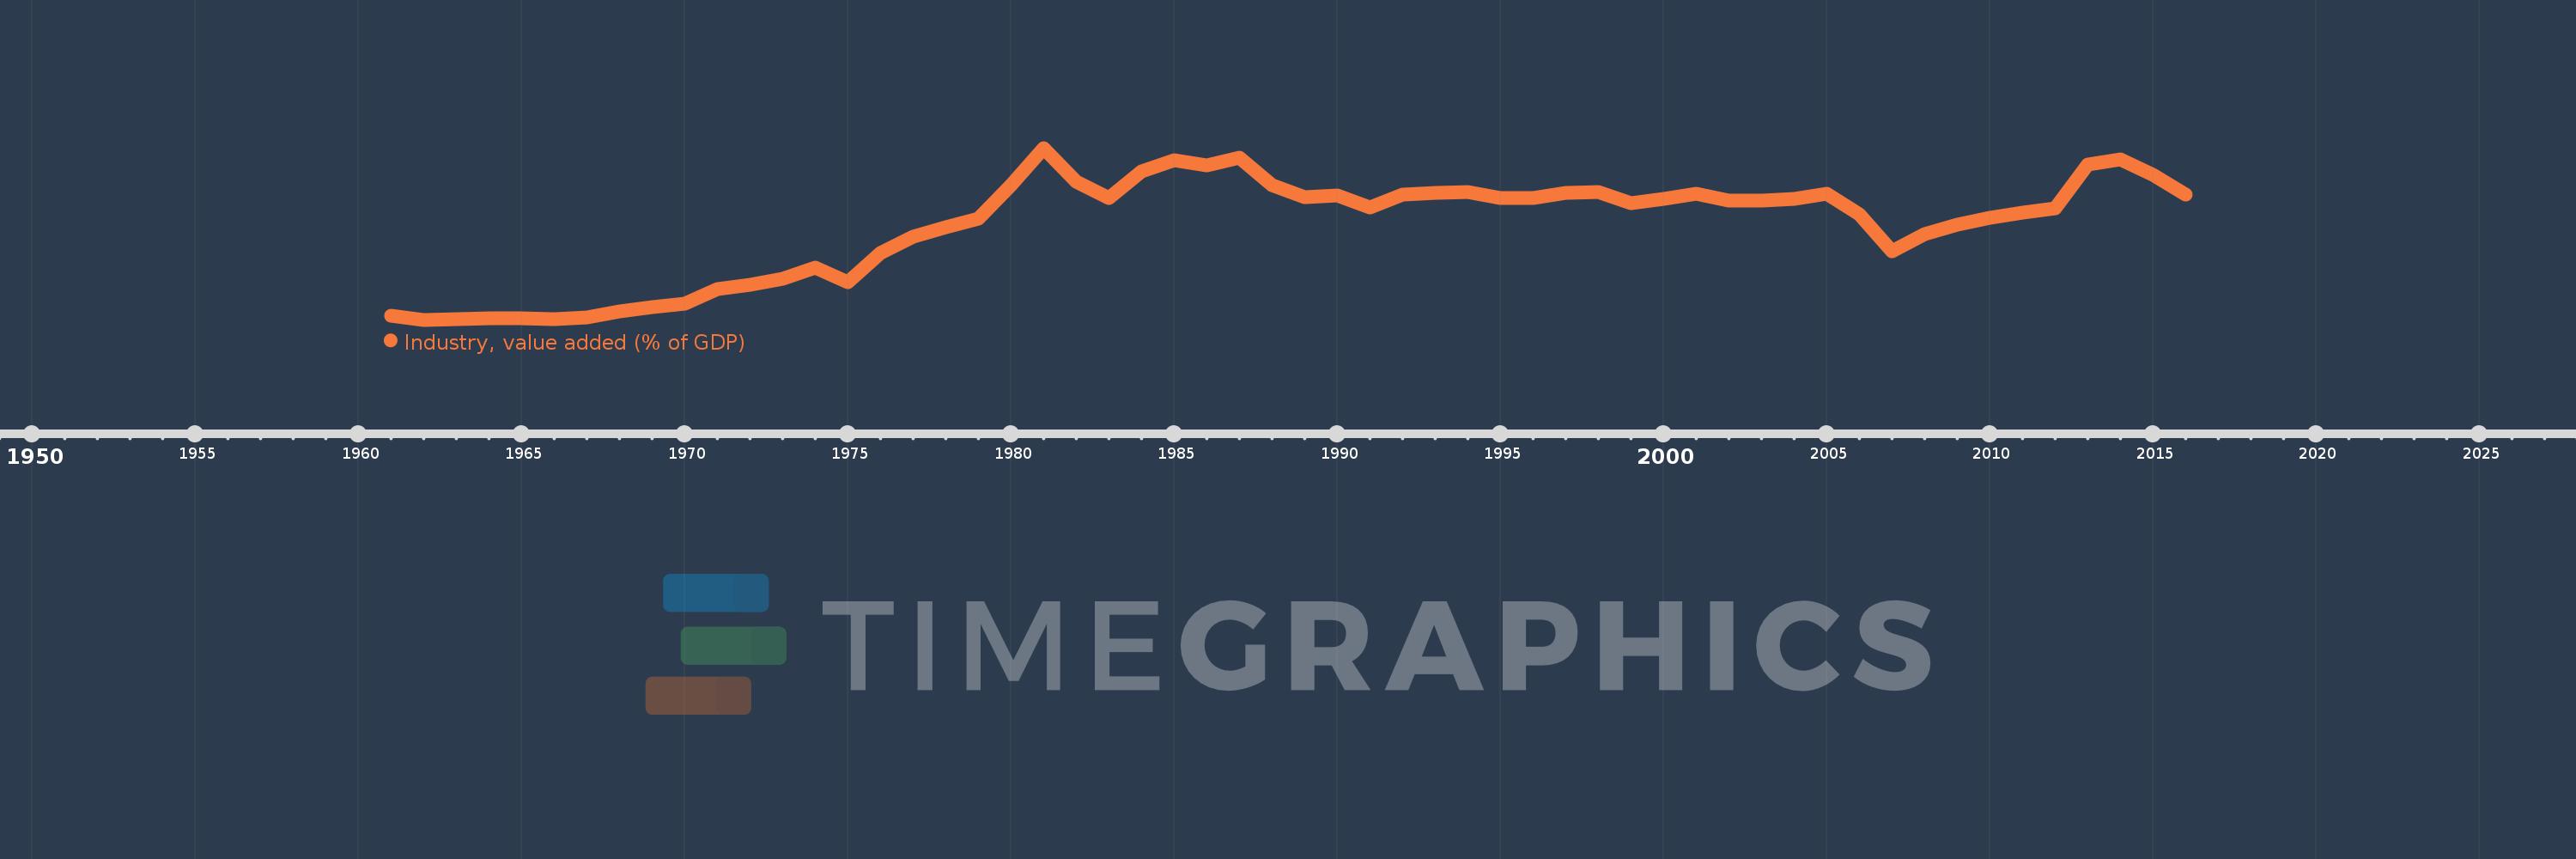
Industry, value added (% of GDP)
2016,2015,2014,2013,2012,2011,2010,2009,2008,2007,2006,2005,2004,2003,2002,2001,2000,1999,1998,1997,1996,1995,1994,1993,1992,1991,1990,1989,1988,1987,1986,1985,1984,1983,1982,1981,1980,1979,1978,1977,1976,1975,1974,1973,1972,1971,1970,1969,1968,1967,1966,1965,1964,1963,1962,1961
Estas estadísticas en otros países:
AfghanistanAlbaniaAlgeriaAndorraAngolaAntigua and BarbudaArab WorldArgentinaArmeniaArubaAustraliaAustriaAzerbaijanBahamas, TheBahrainBangladeshBarbadosBelarusBelgiumBelizeBeninBermudaBhutanBoliviaBosnia and HerzegovinaBotswanaBrazilBrunei DarussalamBulgariaBurkina FasoBurundiCabo VerdeCambodiaCameroonCanadaCaribbean small statesCayman IslandsCentral African RepublicCentral Europe and the BalticsChadChileChinaColombiaComorosCongo, Dem. Rep.Congo, Rep.Costa RicaCote d'IvoireCroatiaCubaCyprusCzech RepublicDenmarkDjiboutiDominicaDominican RepublicEarly-demographic dividendEast Asia & PacificEast Asia & Pacific (excluding high income)East Asia & Pacific (IDA & IBRD countries)EcuadorEgypt, Arab Rep.El SalvadorEquatorial GuineaEritreaEstoniaEthiopiaEuro areaEurope & Central AsiaEurope & Central Asia (excluding high income)Europe & Central Asia (IDA & IBRD countries)European UnionFijiFinlandFragile and conflict affected situationsFranceGabonGambia, TheGeorgiaGermanyGhanaGreeceGrenadaGuatemalaGuineaGuinea-BissauGuyanaHeavily indebted poor countries (HIPC)High incomeHondurasHong Kong SAR, ChinaHungaryIBRD onlyIcelandIDA & IBRD totalIDA blendIDA onlyIDA totalIndiaIndonesiaIran, Islamic Rep.IrelandItalyJamaicaJapanJordanKazakhstanKenyaKiribatiKorea, Rep.KosovoKuwaitKyrgyz RepublicLao PDRLate-demographic dividendLatin America & Caribbean Latin America & Caribbean (excluding high income)Latin America & the Caribbean (IDA & IBRD countries)LatviaLeast developed countries: UN classificationLebanonLesothoLibyaLiechtensteinLithuaniaLow & middle incomeLow incomeLower middle incomeLuxembourgMacao SAR, ChinaMacedonia, FYRMadagascarMalawiMalaysiaMaldivesMaliMaltaMarshall IslandsMauritaniaMauritiusMexicoMicronesia, Fed. Sts.Middle East & North AfricaMiddle East & North Africa (excluding high income)Middle East & North Africa (IDA & IBRD countries)Middle incomeMoldovaMongoliaMontenegroMoroccoMozambiqueMyanmarNamibiaNepalNetherlandsNew CaledoniaNew ZealandNicaraguaNigerNigeriaNorth AmericaNorwayOECD membersOmanOther small statesPacific island small statesPakistanPalauPanamaPapua New GuineaParaguayPeruPhilippinesPolandPortugalPost-demographic dividendPre-demographic dividendPuerto RicoQatarRomaniaRussian FederationRwandaSao Tome and PrincipeSaudi ArabiaSenegalSerbiaSeychellesSierra LeoneSingaporeSlovak RepublicSloveniaSmall statesSolomon IslandsSomaliaSouth AfricaSouth AsiaSouth Asia (IDA & IBRD)SpainSri LankaSt. Kitts and NevisSt. LuciaSt. Vincent and the GrenadinesSub-Saharan Africa Sub-Saharan Africa (excluding high income)Sub-Saharan Africa (IDA & IBRD countries)SudanSurinameSwazilandSwedenSwitzerlandSyrian Arab RepublicTajikistanTanzaniaThailandTimor-LesteTogoTongaTrinidad and TobagoTunisiaTurkeyTurkmenistanTuvaluUgandaUkraineUnited KingdomUnited StatesUpper middle incomeUruguayUzbekistanVanuatuVenezuela, RBVietnamWest Bank and GazaWorldYemen, Rep.ZambiaZimbabwe línea de tiempo (timeline):
En esta escala de tiempo se presenta un gráfico de 1961 y 2016 de Niger. Los datos de 1960 están ausentes. El número de observaciones reales por fecha: 56.
Fuente (nombre):
Indicadores del desarrollo mundial
Fuente (organización):
World Bank national accounts data, and OECD National Accounts data files.
Categorías:
Economy & Growth
Se ha actualizado:
23 abr 2017 año
Los indicadores de los cambios de valor en los últimos años
Mínimo:
3.446
1 ene 1962 año
Máximo:
22.943
1 ene 1981 año
A la fecha de observación
Valor
Cambio absoluto
El cambio con respecto al valor anterior
1 ene 1961 año
3.886
+3.886
0.0%
1 ene 1962 año
3.446
-0.44
-11.31%
1 ene 1963 año
3.52
+0.073
2.13%
1 ene 1964 año
3.614
+0.094
2.67%
1 ene 1965 año
3.599
-0.014
-0.4%
1 ene 1966 año
3.472
-0.128
-3.54%
1 ene 1967 año
3.721
+0.249
7.17%
1 ene 1968 año
4.434
+0.713
19.17%
1 ene 1969 año
4.855
+0.421
9.5%
1 ene 1970 año
5.245
+0.39
8.02%
1 ene 1971 año
6.941
+1.697
32.36%
1 ene 1972 año
7.397
+0.456
6.57%
1 ene 1973 año
8.102
+0.704
9.52%
1 ene 1974 año
9.378
+1.276
15.75%
1 ene 1975 año
7.735
-1.643
-17.52%
1 ene 1976 año
11.013
+3.278
42.38%
1 ene 1977 año
12.88
+1.866
16.94%
1 ene 1978 año
13.988
+1.108
8.6%
1 ene 1979 año
14.957
+0.97
6.93%
1 ene 1980 año
18.741
+3.783
25.29%
1 ene 1981 año
22.943
+4.203
22.43%
1 ene 1982 año
19.156
-3.788
-16.51%
1 ene 1983 año
17.255
-1.901
-9.92%
1 ene 1984 año
20.245
+2.99
17.33%
1 ene 1985 año
21.597
+1.353
6.68%
1 ene 1986 año
20.921
-0.677
-3.13%
1 ene 1987 año
21.838
+0.917
4.38%
1 ene 1988 año
18.701
-3.137
-14.37%
1 ene 1989 año
17.359
-1.342
-7.18%
1 ene 1990 año
17.546
+0.188
1.08%
1 ene 1991 año
16.153
-1.393
-7.94%
1 ene 1992 año
17.648
+1.494
9.25%
1 ene 1993 año
17.866
+0.218
1.24%
1 ene 1994 año
17.897
+0.031
0.17%
1 ene 1995 año
17.295
-0.603
-3.37%
1 ene 1996 año
17.267
-0.028
-0.16%
1 ene 1997 año
17.8
+0.533
3.09%
1 ene 1998 año
17.916
+0.116
0.65%
1 ene 1999 año
16.716
-1.201
-6.7%
1 ene 2000 año
17.158
+0.442
2.64%
1 ene 2001 año
17.76
+0.603
3.51%
1 ene 2002 año
16.992
-0.768
-4.33%
1 ene 2003 año
16.988
-0.003
-0.02%
1 ene 2004 año
17.121
+0.133
0.78%
1 ene 2005 año
17.766
+0.645
3.77%
1 ene 2006 año
15.36
-2.407
-13.55%
1 ene 2007 año
11.264
-4.095
-26.66%
1 ene 2008 año
13.181
+1.917
17.02%
1 ene 2009 año
14.231
+1.05
7.97%
1 ene 2010 año
15.051
+0.82
5.76%
1 ene 2011 año
15.617
+0.565
3.76%
1 ene 2012 año
16.091
+0.474
3.04%
1 ene 2013 año
21.069
+4.977
30.93%
1 ene 2014 año
21.628
+0.559
2.65%
1 ene 2015 año
19.875
-1.753
-8.1%
1 ene 2016 año
17.625
-2.25
-11.32%
Ranking de los países por los datos estadísticos actuales


Comentarios: