29
/es/
es
AIzaSyAYiBZKx7MnpbEhh9jyipgxe19OcubqV5w
April 1, 2024
164980
Jordan
JOR
true
2
1
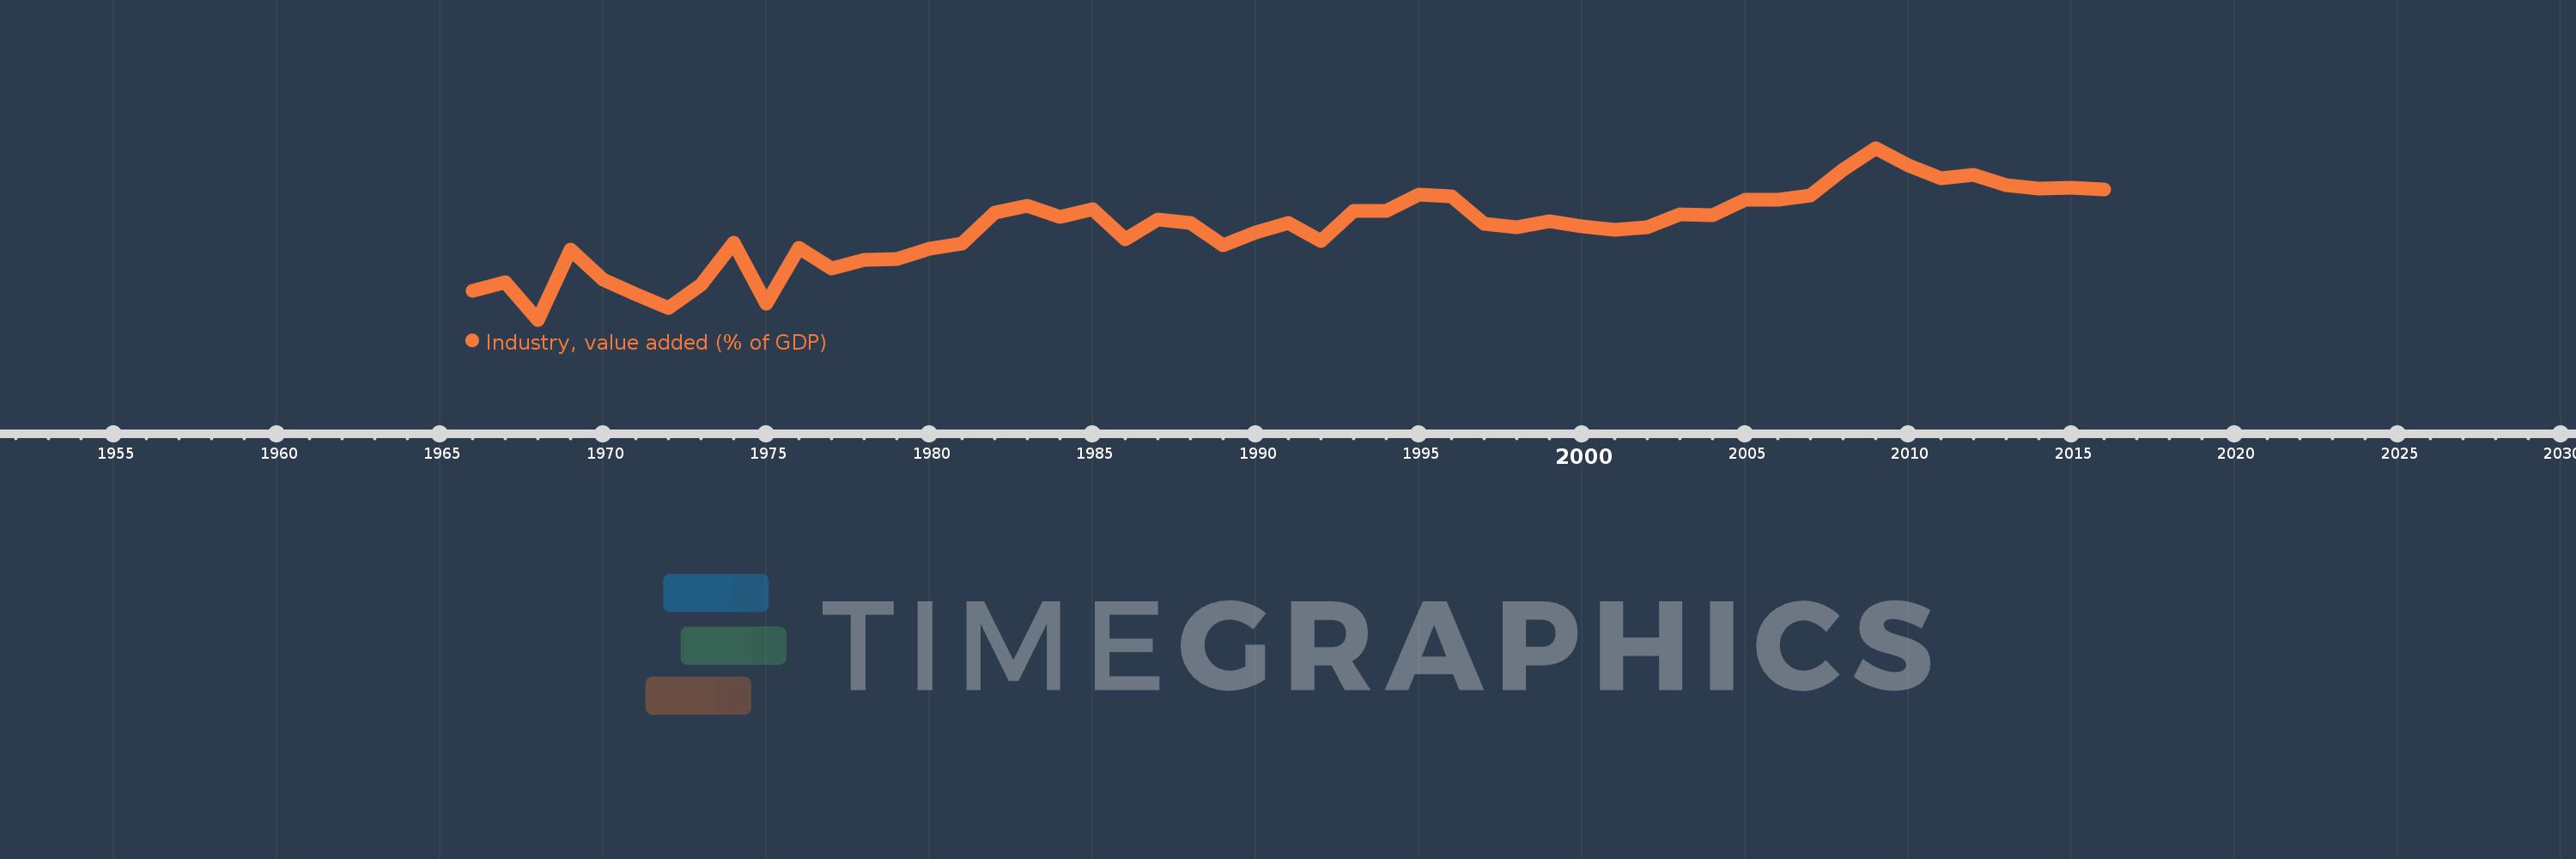
Industry, value added (% of GDP)
2016,2015,2014,2013,2012,2011,2010,2009,2008,2007,2006,2005,2004,2003,2002,2001,2000,1999,1998,1997,1996,1995,1994,1993,1992,1991,1990,1989,1988,1987,1986,1985,1984,1983,1982,1981,1980,1979,1978,1977,1976,1975,1974,1973,1972,1971,1970,1969,1968,1967,1966
Estas estadísticas en otros países:
AfghanistanAlbaniaAlgeriaAndorraAngolaAntigua and BarbudaArab WorldArgentinaArmeniaArubaAustraliaAustriaAzerbaijanBahamas, TheBahrainBangladeshBarbadosBelarusBelgiumBelizeBeninBermudaBhutanBoliviaBosnia and HerzegovinaBotswanaBrazilBrunei DarussalamBulgariaBurkina FasoBurundiCabo VerdeCambodiaCameroonCanadaCaribbean small statesCayman IslandsCentral African RepublicCentral Europe and the BalticsChadChileChinaColombiaComorosCongo, Dem. Rep.Congo, Rep.Costa RicaCote d'IvoireCroatiaCubaCyprusCzech RepublicDenmarkDjiboutiDominicaDominican RepublicEarly-demographic dividendEast Asia & PacificEast Asia & Pacific (excluding high income)East Asia & Pacific (IDA & IBRD countries)EcuadorEgypt, Arab Rep.El SalvadorEquatorial GuineaEritreaEstoniaEthiopiaEuro areaEurope & Central AsiaEurope & Central Asia (excluding high income)Europe & Central Asia (IDA & IBRD countries)European UnionFijiFinlandFragile and conflict affected situationsFranceGabonGambia, TheGeorgiaGermanyGhanaGreeceGrenadaGuatemalaGuineaGuinea-BissauGuyanaHeavily indebted poor countries (HIPC)High incomeHondurasHong Kong SAR, ChinaHungaryIBRD onlyIcelandIDA & IBRD totalIDA blendIDA onlyIDA totalIndiaIndonesiaIran, Islamic Rep.IrelandItalyJamaicaJapanJordanKazakhstanKenyaKiribatiKorea, Rep.KosovoKuwaitKyrgyz RepublicLao PDRLate-demographic dividendLatin America & Caribbean Latin America & Caribbean (excluding high income)Latin America & the Caribbean (IDA & IBRD countries)LatviaLeast developed countries: UN classificationLebanonLesothoLibyaLiechtensteinLithuaniaLow & middle incomeLow incomeLower middle incomeLuxembourgMacao SAR, ChinaMacedonia, FYRMadagascarMalawiMalaysiaMaldivesMaliMaltaMarshall IslandsMauritaniaMauritiusMexicoMicronesia, Fed. Sts.Middle East & North AfricaMiddle East & North Africa (excluding high income)Middle East & North Africa (IDA & IBRD countries)Middle incomeMoldovaMongoliaMontenegroMoroccoMozambiqueMyanmarNamibiaNepalNetherlandsNew CaledoniaNew ZealandNicaraguaNigerNigeriaNorth AmericaNorwayOECD membersOmanOther small statesPacific island small statesPakistanPalauPanamaPapua New GuineaParaguayPeruPhilippinesPolandPortugalPost-demographic dividendPre-demographic dividendPuerto RicoQatarRomaniaRussian FederationRwandaSao Tome and PrincipeSaudi ArabiaSenegalSerbiaSeychellesSierra LeoneSingaporeSlovak RepublicSloveniaSmall statesSolomon IslandsSomaliaSouth AfricaSouth AsiaSouth Asia (IDA & IBRD)SpainSri LankaSt. Kitts and NevisSt. LuciaSt. Vincent and the GrenadinesSub-Saharan Africa Sub-Saharan Africa (excluding high income)Sub-Saharan Africa (IDA & IBRD countries)SudanSurinameSwazilandSwedenSwitzerlandSyrian Arab RepublicTajikistanTanzaniaThailandTimor-LesteTogoTongaTrinidad and TobagoTunisiaTurkeyTurkmenistanTuvaluUgandaUkraineUnited KingdomUnited StatesUpper middle incomeUruguayUzbekistanVanuatuVenezuela, RBVietnamWest Bank and GazaWorldYemen, Rep.ZambiaZimbabwe línea de tiempo (timeline):
En esta escala de tiempo se presenta un gráfico de 1966 y 2016 de Jordan. Los datos de 1965 están ausentes. El número de observaciones reales por fecha: 51.
Fuente (nombre):
Indicadores del desarrollo mundial
Fuente (organización):
World Bank national accounts data, and OECD National Accounts data files.
Categorías:
Economy & Growth
Se ha actualizado:
23 abr 2017 año
Los indicadores de los cambios de valor en los últimos años
Mínimo:
16.404
1 ene 1968 año
Máximo:
33.842
1 ene 2009 año
A la fecha de observación
Valor
Cambio absoluto
El cambio con respecto al valor anterior
1 ene 1966 año
19.307
+19.307
0.0%
1 ene 1967 año
20.215
+0.908
4.7%
1 ene 1968 año
16.404
-3.81
-18.85%
1 ene 1969 año
23.542
+7.138
43.51%
1 ene 1970 año
20.454
-3.089
-13.12%
1 ene 1971 año
18.978
-1.476
-7.22%
1 ene 1972 año
17.616
-1.362
-7.18%
1 ene 1973 año
19.923
+2.308
13.1%
1 ene 1974 año
24.228
+4.304
21.6%
1 ene 1975 año
18.043
-6.184
-25.53%
1 ene 1976 año
23.679
+5.636
31.23%
1 ene 1977 año
21.635
-2.044
-8.63%
1 ene 1978 año
22.522
+0.887
4.1%
1 ene 1979 año
22.533
+0.01
0.05%
1 ene 1980 año
23.604
+1.072
4.76%
1 ene 1981 año
24.15
+0.545
2.31%
1 ene 1982 año
27.277
+3.127
12.95%
1 ene 1983 año
27.945
+0.668
2.45%
1 ene 1984 año
26.866
-1.079
-3.86%
1 ene 1985 año
27.615
+0.749
2.79%
1 ene 1986 año
24.607
-3.008
-10.89%
1 ene 1987 año
26.595
+1.988
8.08%
1 ene 1988 año
26.236
-0.359
-1.35%
1 ene 1989 año
23.933
-2.303
-8.78%
1 ene 1990 año
25.236
+1.303
5.44%
1 ene 1991 año
26.239
+1.002
3.97%
1 ene 1992 año
24.394
-1.845
-7.03%
1 ene 1993 año
27.468
+3.074
12.6%
1 ene 1994 año
27.444
-0.025
-0.09%
1 ene 1995 año
29.135
+1.691
6.16%
1 ene 1996 año
28.923
-0.211
-0.73%
1 ene 1997 año
26.135
-2.789
-9.64%
1 ene 1998 año
25.831
-0.304
-1.16%
1 ene 1999 año
26.444
+0.613
2.37%
1 ene 2000 año
25.921
-0.524
-1.98%
1 ene 2001 año
25.545
-0.376
-1.45%
1 ene 2002 año
25.761
+0.216
0.85%
1 ene 2003 año
27.09
+1.329
5.16%
1 ene 2004 año
27.046
-0.044
-0.16%
1 ene 2005 año
28.601
+1.555
5.75%
1 ene 2006 año
28.612
+0.011
0.04%
1 ene 2007 año
28.98
+0.369
1.29%
1 ene 2008 año
31.617
+2.637
9.1%
1 ene 2009 año
33.842
+2.225
7.04%
1 ene 2010 año
32.08
-1.761
-5.2%
1 ene 2011 año
30.725
-1.356
-4.23%
1 ene 2012 año
31.101
+0.376
1.22%
1 ene 2013 año
30.062
-1.038
-3.34%
1 ene 2014 año
29.692
-0.37
-1.23%
1 ene 2015 año
29.794
+0.102
0.34%
1 ene 2016 año
29.641
-0.154
-0.52%
Ranking de los países por los datos estadísticos actuales


Comentarios: