29
/es/
es
AIzaSyAYiBZKx7MnpbEhh9jyipgxe19OcubqV5w
April 1, 2024
63029
World
WLD
false
2
1
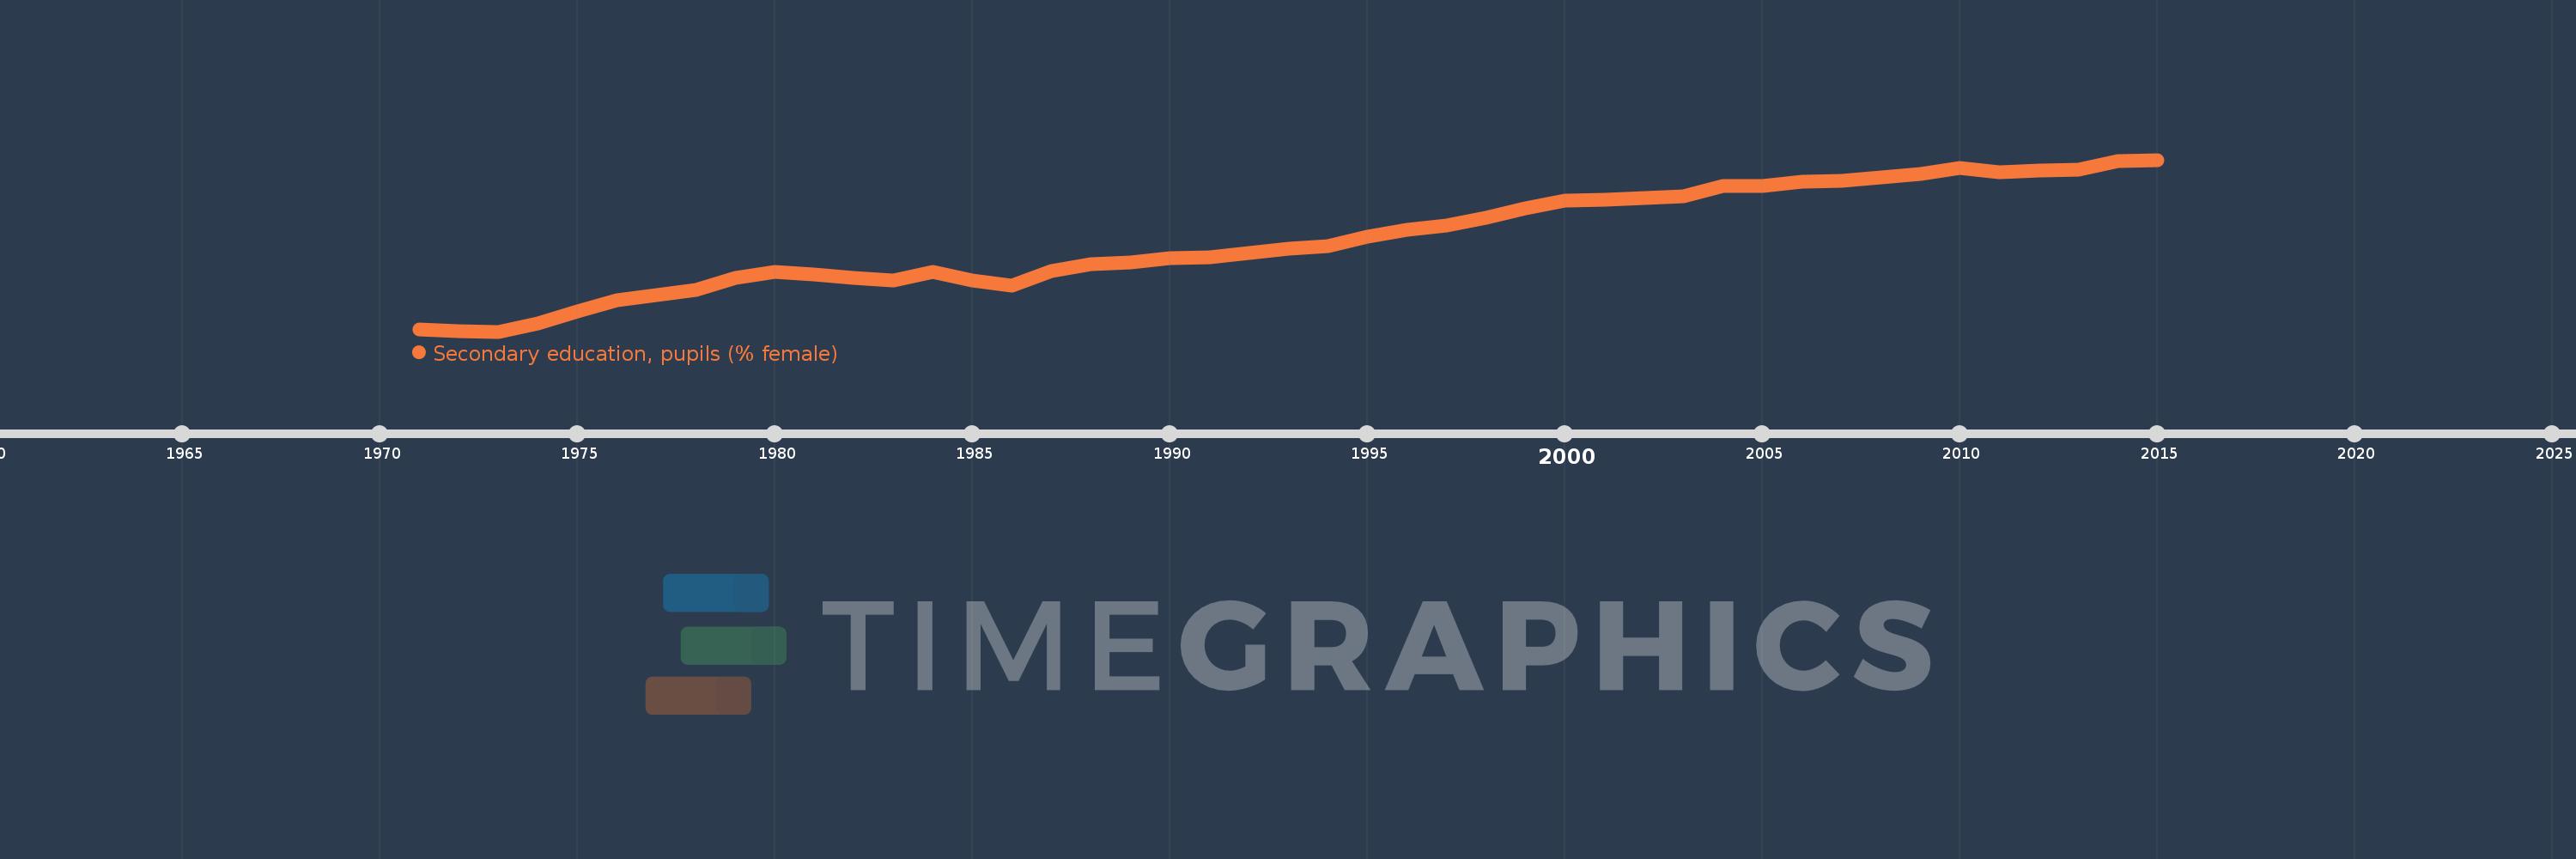
Secondary education, pupils (% female)
2015,2014,2013,2012,2011,2010,2009,2008,2007,2006,2005,2004,2003,2002,2001,2000,1999,1998,1997,1996,1995,1994,1993,1992,1991,1990,1989,1988,1987,1986,1985,1984,1983,1982,1981,1980,1979,1978,1977,1976,1975,1974,1973,1972,1971
Estas estadísticas en otros países:
AfghanistanAlbaniaAlgeriaAndorraAngolaAntigua and BarbudaArab WorldArgentinaArmeniaArubaAustraliaAustriaAzerbaijanBahamas, TheBahrainBangladeshBarbadosBelarusBelgiumBelizeBeninBermudaBhutanBoliviaBosnia and HerzegovinaBotswanaBrazilBritish Virgin IslandsBrunei DarussalamBulgariaBurkina FasoBurundiCabo VerdeCambodiaCameroonCanadaCaribbean small statesCayman IslandsCentral African RepublicCentral Europe and the BalticsChadChileChinaColombiaComorosCongo, Dem. Rep.Congo, Rep.Costa RicaCote d'IvoireCroatiaCubaCuracaoCyprusCzech RepublicDenmarkDjiboutiDominicaDominican RepublicEarly-demographic dividendEast Asia & PacificEast Asia & Pacific (excluding high income)East Asia & Pacific (IDA & IBRD countries)EcuadorEgypt, Arab Rep.El SalvadorEquatorial GuineaEritreaEstoniaEthiopiaEuro areaEurope & Central AsiaEurope & Central Asia (excluding high income)Europe & Central Asia (IDA & IBRD countries)European UnionFijiFinlandFragile and conflict affected situationsFranceGabonGambia, TheGeorgiaGermanyGhanaGibraltarGreeceGrenadaGuatemalaGuineaGuinea-BissauGuyanaHeavily indebted poor countries (HIPC)High incomeHondurasHong Kong SAR, ChinaHungaryIBRD onlyIcelandIDA & IBRD totalIDA blendIDA onlyIDA totalIndiaIndonesiaIran, Islamic Rep.IraqIrelandIsraelItalyJamaicaJapanJordanKazakhstanKenyaKiribatiKorea, Dem. People’s Rep.Korea, Rep.KuwaitKyrgyz RepublicLao PDRLate-demographic dividendLatin America & Caribbean Latin America & Caribbean (excluding high income)Latin America & the Caribbean (IDA & IBRD countries)LatviaLeast developed countries: UN classificationLebanonLesothoLiberiaLibyaLiechtensteinLithuaniaLow & middle incomeLow incomeLower middle incomeLuxembourgMacao SAR, ChinaMacedonia, FYRMadagascarMalawiMalaysiaMaldivesMaliMaltaMarshall IslandsMauritaniaMauritiusMexicoMicronesia, Fed. Sts.Middle East & North AfricaMiddle East & North Africa (excluding high income)Middle East & North Africa (IDA & IBRD countries)Middle incomeMoldovaMonacoMongoliaMontenegroMoroccoMozambiqueMyanmarNamibiaNauruNepalNetherlandsNew ZealandNicaraguaNigerNigeriaNorth AmericaNorwayOECD membersOmanOther small statesPacific island small statesPakistanPalauPanamaPapua New GuineaParaguayPeruPhilippinesPolandPortugalPost-demographic dividendPre-demographic dividendPuerto RicoQatarRomaniaRussian FederationRwandaSamoaSan MarinoSao Tome and PrincipeSaudi ArabiaSenegalSerbiaSeychellesSierra LeoneSingaporeSint Maarten (Dutch part)Slovak RepublicSloveniaSmall statesSolomon IslandsSomaliaSouth AfricaSouth AsiaSouth Asia (IDA & IBRD)SpainSri LankaSt. Kitts and NevisSt. LuciaSt. Vincent and the GrenadinesSub-Saharan Africa Sub-Saharan Africa (excluding high income)Sub-Saharan Africa (IDA & IBRD countries)SudanSurinameSwazilandSwedenSwitzerlandSyrian Arab RepublicTajikistanTanzaniaThailandTimor-LesteTogoTongaTrinidad and TobagoTunisiaTurkeyTurkmenistanTurks and Caicos IslandsTuvaluUgandaUkraineUnited Arab EmiratesUnited KingdomUnited StatesUpper middle incomeUruguayUzbekistanVanuatuVenezuela, RBVietnamWest Bank and GazaWorldYemen, Rep.ZambiaZimbabwe línea de tiempo (timeline):
En esta escala de tiempo se presenta un gráfico de 1971 y 2015 de World. Los datos de 1970 están ausentes. El número de observaciones reales por fecha: 45.
Fuente (nombre):
Indicadores del desarrollo mundial
Fuente (organización):
United Nations Educational, Scientific, and Cultural Organization (UNESCO) Institute for Statistics.
Categorías:
Education, Gender
Se ha actualizado:
23 abr 2017 año
Los indicadores de los cambios de valor en los últimos años
Mínimo:
42.169
1 ene 1973 año
Máximo:
47.953
1 ene 2015 año
A la fecha de observación
Valor
Cambio absoluto
El cambio con respecto al valor anterior
1 ene 1971 año
42.242
+42.242
0.0%
1 ene 1972 año
42.183
-0.059
-0.14%
1 ene 1973 año
42.169
-0.015
-0.03%
1 ene 1974 año
42.45
+0.281
0.67%
1 ene 1975 año
42.842
+0.391
0.92%
1 ene 1976 año
43.238
+0.397
0.93%
1 ene 1977 año
43.394
+0.156
0.36%
1 ene 1978 año
43.563
+0.169
0.39%
1 ene 1979 año
43.969
+0.406
0.93%
1 ene 1980 año
44.176
+0.208
0.47%
1 ene 1981 año
44.105
-0.071
-0.16%
1 ene 1982 año
43.972
-0.133
-0.3%
1 ene 1983 año
43.889
-0.083
-0.19%
1 ene 1984 año
44.173
+0.285
0.65%
1 ene 1985 año
43.902
-0.272
-0.62%
1 ene 1986 año
43.723
-0.178
-0.41%
1 ene 1987 año
44.209
+0.485
1.11%
1 ene 1988 año
44.435
+0.226
0.51%
1 ene 1989 año
44.502
+0.067
0.15%
1 ene 1990 año
44.636
+0.134
0.3%
1 ene 1991 año
44.667
+0.031
0.07%
1 ene 1992 año
44.808
+0.141
0.32%
1 ene 1993 año
44.96
+0.152
0.34%
1 ene 1994 año
45.055
+0.095
0.21%
1 ene 1995 año
45.372
+0.317
0.7%
1 ene 1996 año
45.607
+0.235
0.52%
1 ene 1997 año
45.751
+0.144
0.32%
1 ene 1998 año
45.988
+0.237
0.52%
1 ene 1999 año
46.311
+0.322
0.7%
1 ene 2000 año
46.565
+0.254
0.55%
1 ene 2001 año
46.617
+0.053
0.11%
1 ene 2002 año
46.663
+0.046
0.1%
1 ene 2003 año
46.735
+0.072
0.15%
1 ene 2004 año
47.062
+0.327
0.7%
1 ene 2005 año
47.062
0.0
0.0%
1 ene 2006 año
47.211
+0.149
0.32%
1 ene 2007 año
47.256
+0.045
0.1%
1 ene 2008 año
47.353
+0.097
0.21%
1 ene 2009 año
47.467
+0.114
0.24%
1 ene 2010 año
47.69
+0.223
0.47%
1 ene 2011 año
47.532
-0.158
-0.33%
1 ene 2012 año
47.583
+0.051
0.11%
1 ene 2013 año
47.621
+0.037
0.08%
1 ene 2014 año
47.901
+0.28
0.59%
1 ene 2015 año
47.953
+0.052
0.11%
Ranking de los países por los datos estadísticos actuales


Comentarios: