29
/es/
es
AIzaSyAYiBZKx7MnpbEhh9jyipgxe19OcubqV5w
April 1, 2024
37785
IDA & IBRD total
IBT
false
2
1
Secondary education, pupils (% female)
2015,2014,2013,2012,2011,2010,2009,2008,2007,2006,2005,2004,2003,2002,2001,2000,1999,1998,1997,1996,1995,1994,1993,1992,1991,1990,1989,1988,1987,1986,1985,1984,1983,1982,1981,1980,1979,1978,1977,1976,1975,1974,1973,1972,1971
Estas estadísticas en otros países:
AfghanistanAlbaniaAlgeriaAndorraAngolaAntigua and BarbudaArab WorldArgentinaArmeniaArubaAustraliaAustriaAzerbaijanBahamas, TheBahrainBangladeshBarbadosBelarusBelgiumBelizeBeninBermudaBhutanBoliviaBosnia and HerzegovinaBotswanaBrazilBritish Virgin IslandsBrunei DarussalamBulgariaBurkina FasoBurundiCabo VerdeCambodiaCameroonCanadaCaribbean small statesCayman IslandsCentral African RepublicCentral Europe and the BalticsChadChileChinaColombiaComorosCongo, Dem. Rep.Congo, Rep.Costa RicaCote d'IvoireCroatiaCubaCuracaoCyprusCzech RepublicDenmarkDjiboutiDominicaDominican RepublicEarly-demographic dividendEast Asia & PacificEast Asia & Pacific (excluding high income)East Asia & Pacific (IDA & IBRD countries)EcuadorEgypt, Arab Rep.El SalvadorEquatorial GuineaEritreaEstoniaEthiopiaEuro areaEurope & Central AsiaEurope & Central Asia (excluding high income)Europe & Central Asia (IDA & IBRD countries)European UnionFijiFinlandFragile and conflict affected situationsFranceGabonGambia, TheGeorgiaGermanyGhanaGibraltarGreeceGrenadaGuatemalaGuineaGuinea-BissauGuyanaHeavily indebted poor countries (HIPC)High incomeHondurasHong Kong SAR, ChinaHungaryIBRD onlyIcelandIDA & IBRD totalIDA blendIDA onlyIDA totalIndiaIndonesiaIran, Islamic Rep.IraqIrelandIsraelItalyJamaicaJapanJordanKazakhstanKenyaKiribatiKorea, Dem. People’s Rep.Korea, Rep.KuwaitKyrgyz RepublicLao PDRLate-demographic dividendLatin America & Caribbean Latin America & Caribbean (excluding high income)Latin America & the Caribbean (IDA & IBRD countries)LatviaLeast developed countries: UN classificationLebanonLesothoLiberiaLibyaLiechtensteinLithuaniaLow & middle incomeLow incomeLower middle incomeLuxembourgMacao SAR, ChinaMacedonia, FYRMadagascarMalawiMalaysiaMaldivesMaliMaltaMarshall IslandsMauritaniaMauritiusMexicoMicronesia, Fed. Sts.Middle East & North AfricaMiddle East & North Africa (excluding high income)Middle East & North Africa (IDA & IBRD countries)Middle incomeMoldovaMonacoMongoliaMontenegroMoroccoMozambiqueMyanmarNamibiaNauruNepalNetherlandsNew ZealandNicaraguaNigerNigeriaNorth AmericaNorwayOECD membersOmanOther small statesPacific island small statesPakistanPalauPanamaPapua New GuineaParaguayPeruPhilippinesPolandPortugalPost-demographic dividendPre-demographic dividendPuerto RicoQatarRomaniaRussian FederationRwandaSamoaSan MarinoSao Tome and PrincipeSaudi ArabiaSenegalSerbiaSeychellesSierra LeoneSingaporeSint Maarten (Dutch part)Slovak RepublicSloveniaSmall statesSolomon IslandsSomaliaSouth AfricaSouth AsiaSouth Asia (IDA & IBRD)SpainSri LankaSt. Kitts and NevisSt. LuciaSt. Vincent and the GrenadinesSub-Saharan Africa Sub-Saharan Africa (excluding high income)Sub-Saharan Africa (IDA & IBRD countries)SudanSurinameSwazilandSwedenSwitzerlandSyrian Arab RepublicTajikistanTanzaniaThailandTimor-LesteTogoTongaTrinidad and TobagoTunisiaTurkeyTurkmenistanTurks and Caicos IslandsTuvaluUgandaUkraineUnited Arab EmiratesUnited KingdomUnited StatesUpper middle incomeUruguayUzbekistanVanuatuVenezuela, RBVietnamWest Bank and GazaWorldYemen, Rep.ZambiaZimbabwe línea de tiempo (timeline):
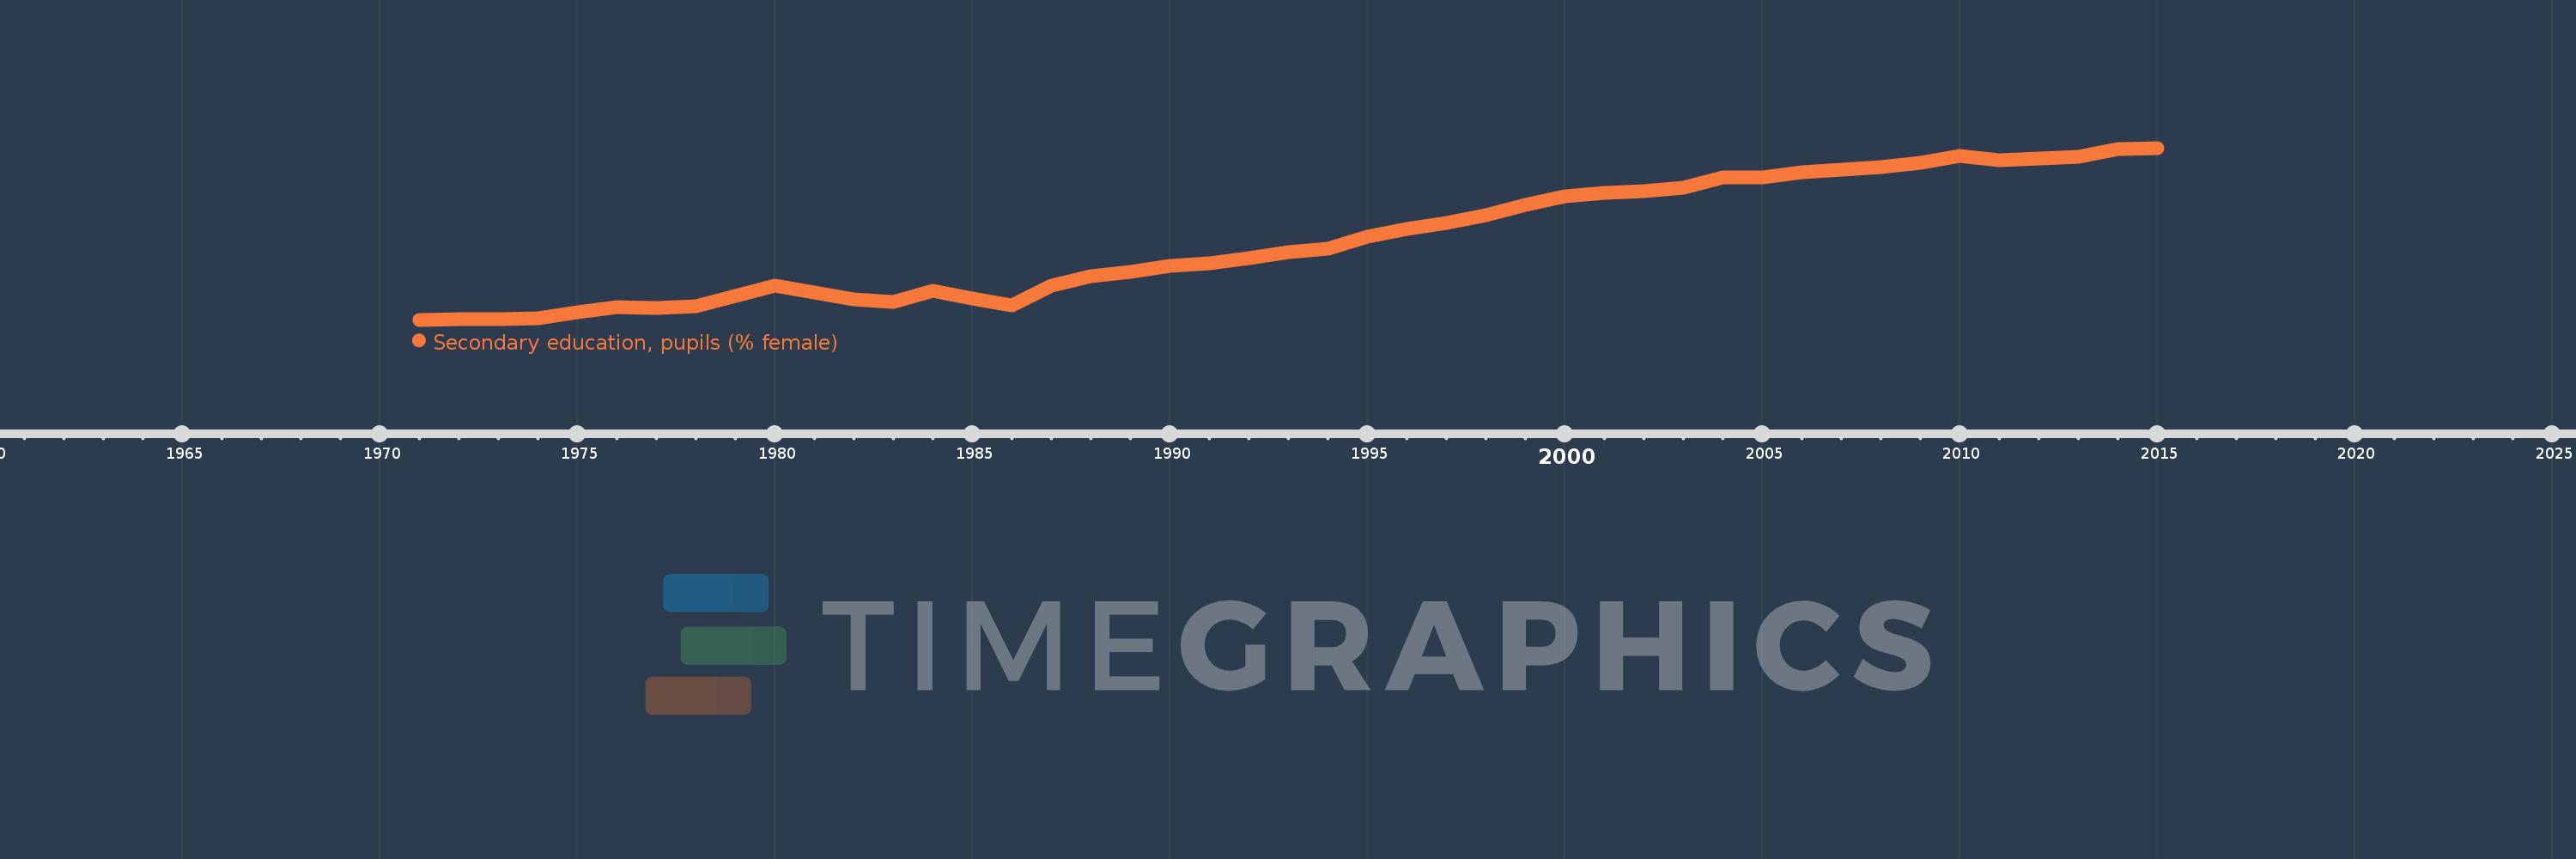
En esta escala de tiempo se presenta un gráfico de 1971 y 2015 de IDA & IBRD total. Los datos de 1970 están ausentes. El número de observaciones reales por fecha: 45.
Fuente (nombre):
Indicadores del desarrollo mundial
Fuente (organización):
United Nations Educational, Scientific, and Cultural Organization (UNESCO) Institute for Statistics.
Categorías:
Education, Gender
Se ha actualizado:
23 abr 2017 año
Los indicadores de los cambios de valor en los últimos años
Mínimo:
41.071
1 ene 1971 año
Máximo:
47.83
1 ene 2015 año
A la fecha de observación
Valor
Cambio absoluto
El cambio con respecto al valor anterior
1 ene 1971 año
41.071
+41.071
0.0%
1 ene 1972 año
41.078
+0.007
0.02%
1 ene 1973 año
41.089
+0.012
0.03%
1 ene 1974 año
41.127
+0.038
0.09%
1 ene 1975 año
41.378
+0.251
0.61%
1 ene 1976 año
41.562
+0.184
0.44%
1 ene 1977 año
41.534
-0.027
-0.07%
1 ene 1978 año
41.608
+0.073
0.18%
1 ene 1979 año
41.998
+0.391
0.94%
1 ene 1980 año
42.408
+0.41
0.98%
1 ene 1981 año
42.15
-0.259
-0.61%
1 ene 1982 año
41.883
-0.267
-0.63%
1 ene 1983 año
41.78
-0.103
-0.25%
1 ene 1984 año
42.194
+0.414
0.99%
1 ene 1985 año
41.889
-0.304
-0.72%
1 ene 1986 año
41.632
-0.258
-0.62%
1 ene 1987 año
42.425
+0.793
1.91%
1 ene 1988 año
42.776
+0.352
0.83%
1 ene 1989 año
42.95
+0.174
0.41%
1 ene 1990 año
43.187
+0.237
0.55%
1 ene 1991 año
43.288
+0.101
0.23%
1 ene 1992 año
43.48
+0.192
0.44%
1 ene 1993 año
43.715
+0.235
0.54%
1 ene 1994 año
43.878
+0.163
0.37%
1 ene 1995 año
44.351
+0.473
1.08%
1 ene 1996 año
44.639
+0.288
0.65%
1 ene 1997 año
44.876
+0.237
0.53%
1 ene 1998 año
45.178
+0.302
0.67%
1 ene 1999 año
45.583
+0.405
0.9%
1 ene 2000 año
45.943
+0.36
0.79%
1 ene 2001 año
46.059
+0.115
0.25%
1 ene 2002 año
46.126
+0.067
0.15%
1 ene 2003 año
46.278
+0.152
0.33%
1 ene 2004 año
46.671
+0.393
0.85%
1 ene 2005 año
46.678
+0.006
0.01%
1 ene 2006 año
46.871
+0.193
0.41%
1 ene 2007 año
46.973
+0.102
0.22%
1 ene 2008 año
47.083
+0.11
0.23%
1 ene 2009 año
47.246
+0.163
0.35%
1 ene 2010 año
47.511
+0.264
0.56%
1 ene 2011 año
47.34
-0.171
-0.36%
1 ene 2012 año
47.42
+0.08
0.17%
1 ene 2013 año
47.468
+0.048
0.1%
1 ene 2014 año
47.77
+0.302
0.64%
1 ene 2015 año
47.83
+0.06
0.13%
Ranking de los países por los datos estadísticos actuales


Comentarios: