29
/es/
es
AIzaSyAYiBZKx7MnpbEhh9jyipgxe19OcubqV5w
April 1, 2024
257780
Switzerland
CHE
true
2
1
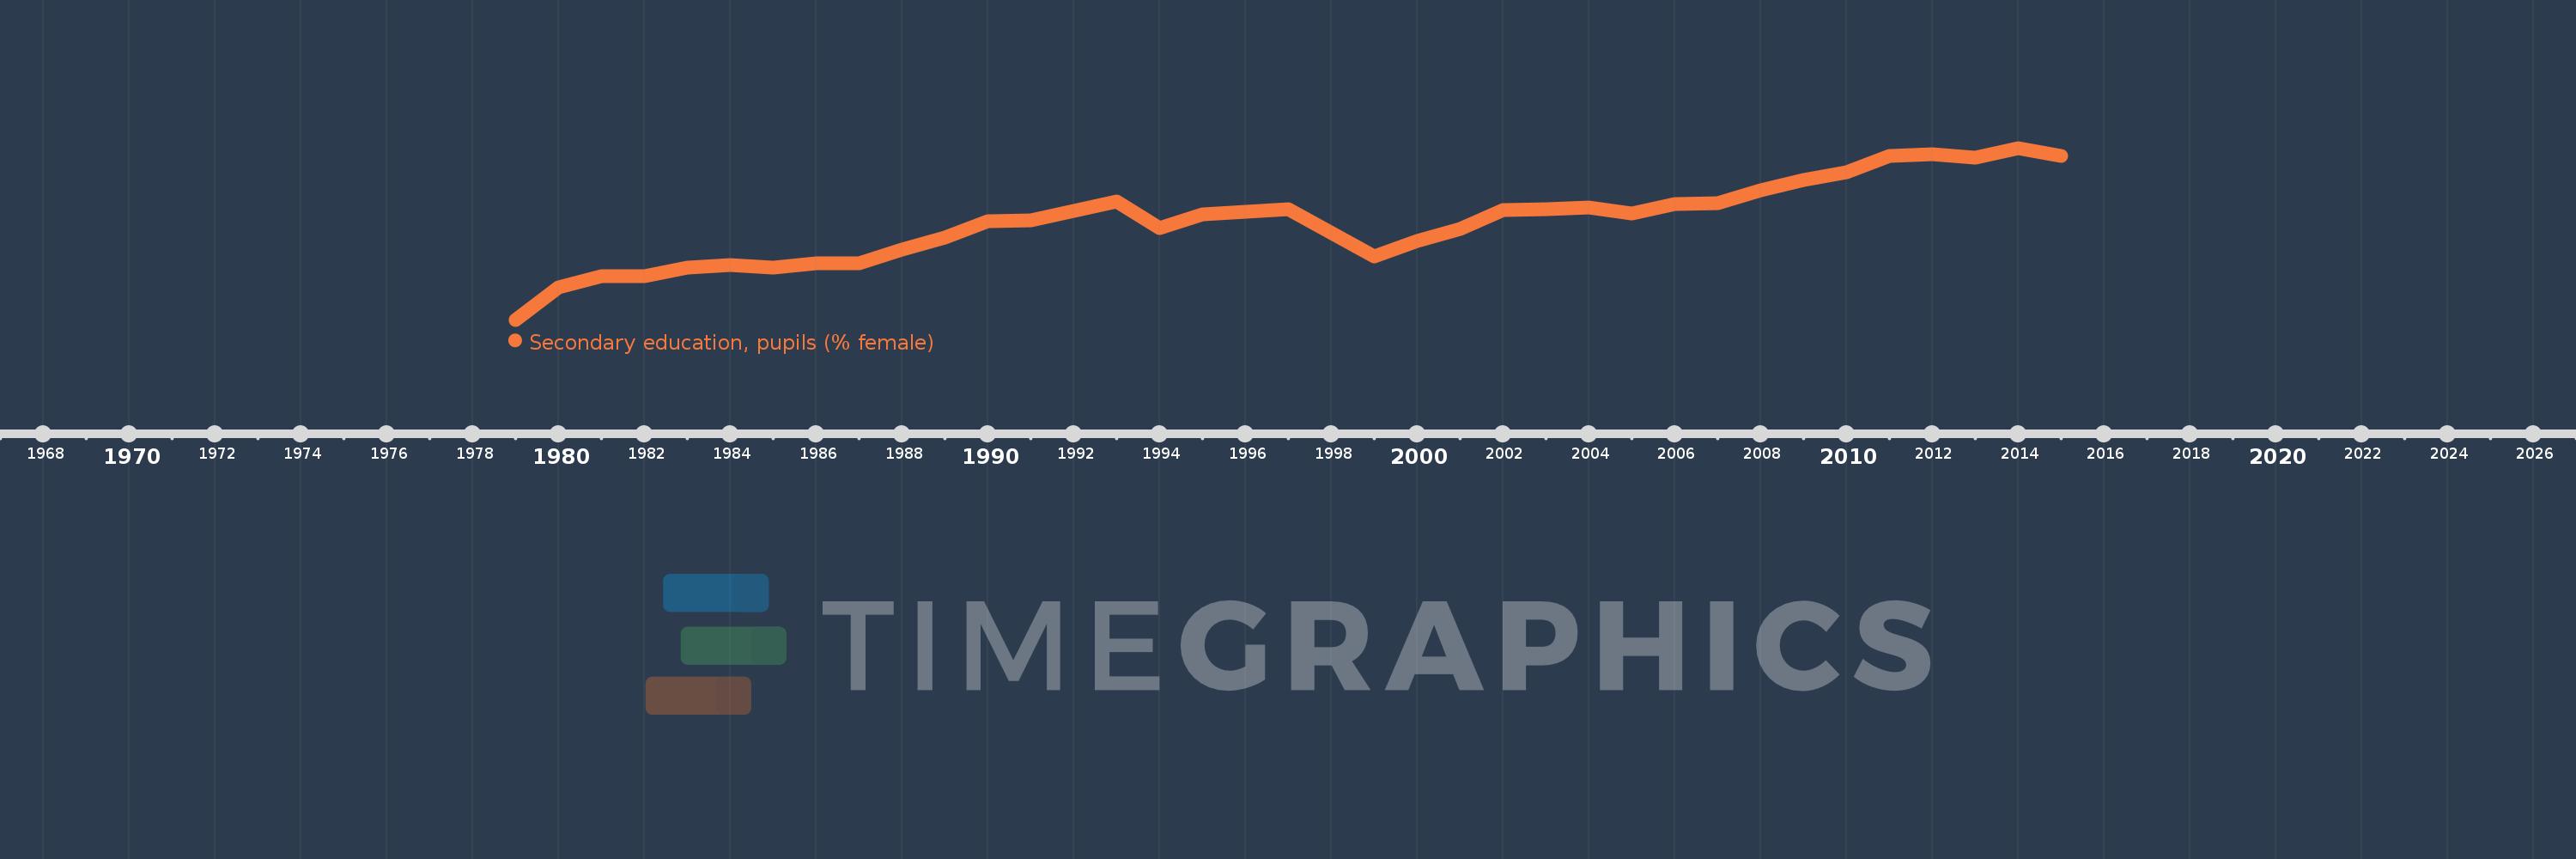
Secondary education, pupils (% female)
2015,2014,2013,2012,2011,2010,2009,2008,2007,2006,2005,2004,2003,2002,2001,2000,1999,1997,1996,1995,1994,1993,1992,1991,1990,1989,1988,1987,1986,1985,1984,1983,1982,1981,1980,1979
Estas estadísticas en otros países:
AfghanistanAlbaniaAlgeriaAndorraAngolaAntigua and BarbudaArab WorldArgentinaArmeniaArubaAustraliaAustriaAzerbaijanBahamas, TheBahrainBangladeshBarbadosBelarusBelgiumBelizeBeninBermudaBhutanBoliviaBosnia and HerzegovinaBotswanaBrazilBritish Virgin IslandsBrunei DarussalamBulgariaBurkina FasoBurundiCabo VerdeCambodiaCameroonCanadaCaribbean small statesCayman IslandsCentral African RepublicCentral Europe and the BalticsChadChileChinaColombiaComorosCongo, Dem. Rep.Congo, Rep.Costa RicaCote d'IvoireCroatiaCubaCuracaoCyprusCzech RepublicDenmarkDjiboutiDominicaDominican RepublicEarly-demographic dividendEast Asia & PacificEast Asia & Pacific (excluding high income)East Asia & Pacific (IDA & IBRD countries)EcuadorEgypt, Arab Rep.El SalvadorEquatorial GuineaEritreaEstoniaEthiopiaEuro areaEurope & Central AsiaEurope & Central Asia (excluding high income)Europe & Central Asia (IDA & IBRD countries)European UnionFijiFinlandFragile and conflict affected situationsFranceGabonGambia, TheGeorgiaGermanyGhanaGibraltarGreeceGrenadaGuatemalaGuineaGuinea-BissauGuyanaHeavily indebted poor countries (HIPC)High incomeHondurasHong Kong SAR, ChinaHungaryIBRD onlyIcelandIDA & IBRD totalIDA blendIDA onlyIDA totalIndiaIndonesiaIran, Islamic Rep.IraqIrelandIsraelItalyJamaicaJapanJordanKazakhstanKenyaKiribatiKorea, Dem. People’s Rep.Korea, Rep.KuwaitKyrgyz RepublicLao PDRLate-demographic dividendLatin America & Caribbean Latin America & Caribbean (excluding high income)Latin America & the Caribbean (IDA & IBRD countries)LatviaLeast developed countries: UN classificationLebanonLesothoLiberiaLibyaLiechtensteinLithuaniaLow & middle incomeLow incomeLower middle incomeLuxembourgMacao SAR, ChinaMacedonia, FYRMadagascarMalawiMalaysiaMaldivesMaliMaltaMarshall IslandsMauritaniaMauritiusMexicoMicronesia, Fed. Sts.Middle East & North AfricaMiddle East & North Africa (excluding high income)Middle East & North Africa (IDA & IBRD countries)Middle incomeMoldovaMonacoMongoliaMontenegroMoroccoMozambiqueMyanmarNamibiaNauruNepalNetherlandsNew ZealandNicaraguaNigerNigeriaNorth AmericaNorwayOECD membersOmanOther small statesPacific island small statesPakistanPalauPanamaPapua New GuineaParaguayPeruPhilippinesPolandPortugalPost-demographic dividendPre-demographic dividendPuerto RicoQatarRomaniaRussian FederationRwandaSamoaSan MarinoSao Tome and PrincipeSaudi ArabiaSenegalSerbiaSeychellesSierra LeoneSingaporeSint Maarten (Dutch part)Slovak RepublicSloveniaSmall statesSolomon IslandsSomaliaSouth AfricaSouth AsiaSouth Asia (IDA & IBRD)SpainSri LankaSt. Kitts and NevisSt. LuciaSt. Vincent and the GrenadinesSub-Saharan Africa Sub-Saharan Africa (excluding high income)Sub-Saharan Africa (IDA & IBRD countries)SudanSurinameSwazilandSwedenSwitzerlandSyrian Arab RepublicTajikistanTanzaniaThailandTimor-LesteTogoTongaTrinidad and TobagoTunisiaTurkeyTurkmenistanTurks and Caicos IslandsTuvaluUgandaUkraineUnited Arab EmiratesUnited KingdomUnited StatesUpper middle incomeUruguayUzbekistanVanuatuVenezuela, RBVietnamWest Bank and GazaWorldYemen, Rep.ZambiaZimbabwe línea de tiempo (timeline):
En esta escala de tiempo se presenta un gráfico de 1979 y 2015 de Switzerland. Los datos de 1978 están ausentes. El número de observaciones reales por fecha: 36.
Fuente (nombre):
Indicadores del desarrollo mundial
Fuente (organización):
United Nations Educational, Scientific, and Cultural Organization (UNESCO) Institute for Statistics.
Categorías:
Education, Gender
Se ha actualizado:
23 abr 2017 año
Los indicadores de los cambios de valor en los últimos años
Mínimo:
45.722
1 ene 1979 año
Máximo:
48.056
1 ene 2014 año
A la fecha de observación
Valor
Cambio absoluto
El cambio con respecto al valor anterior
1 ene 1979 año
45.722
+45.722
0.0%
1 ene 1980 año
46.16
+0.438
0.96%
1 ene 1981 año
46.318
+0.158
0.34%
1 ene 1982 año
46.308
-0.01
-0.02%
1 ene 1983 año
46.426
+0.118
0.25%
1 ene 1984 año
46.464
+0.038
0.08%
1 ene 1985 año
46.427
-0.037
-0.08%
1 ene 1986 año
46.487
+0.06
0.13%
1 ene 1987 año
46.493
+0.007
0.01%
1 ene 1988 año
46.672
+0.179
0.38%
1 ene 1989 año
46.84
+0.168
0.36%
1 ene 1990 año
47.06
+0.22
0.47%
1 ene 1991 año
47.072
+0.012
0.03%
1 ene 1992 año
47.195
+0.123
0.26%
1 ene 1993 año
47.332
+0.137
0.29%
1 ene 1994 año
46.967
-0.364
-0.77%
1 ene 1995 año
47.154
+0.187
0.4%
1 ene 1996 año
47.191
+0.037
0.08%
1 ene 1997 año
47.22
+0.029
0.06%
1 ene 1999 año
46.584
-0.636
-1.35%
1 ene 2000 año
46.797
+0.212
0.46%
1 ene 2001 año
46.961
+0.165
0.35%
1 ene 2002 año
47.215
+0.253
0.54%
1 ene 2003 año
47.221
+0.006
0.01%
1 ene 2004 año
47.252
+0.031
0.07%
1 ene 2005 año
47.168
-0.084
-0.18%
1 ene 2006 año
47.298
+0.13
0.28%
1 ene 2007 año
47.307
+0.009
0.02%
1 ene 2008 año
47.485
+0.178
0.38%
1 ene 2009 año
47.624
+0.139
0.29%
1 ene 2010 año
47.721
+0.097
0.2%
1 ene 2011 año
47.944
+0.223
0.47%
1 ene 2012 año
47.972
+0.028
0.06%
1 ene 2013 año
47.928
-0.044
-0.09%
1 ene 2014 año
48.056
+0.128
0.27%
1 ene 2015 año
47.942
-0.114
-0.24%
Ranking de los países por los datos estadísticos actuales


Comentarios: