29
/es/
es
AIzaSyAYiBZKx7MnpbEhh9jyipgxe19OcubqV5w
April 1, 2024
202282
Morocco
MAR
true
2
1
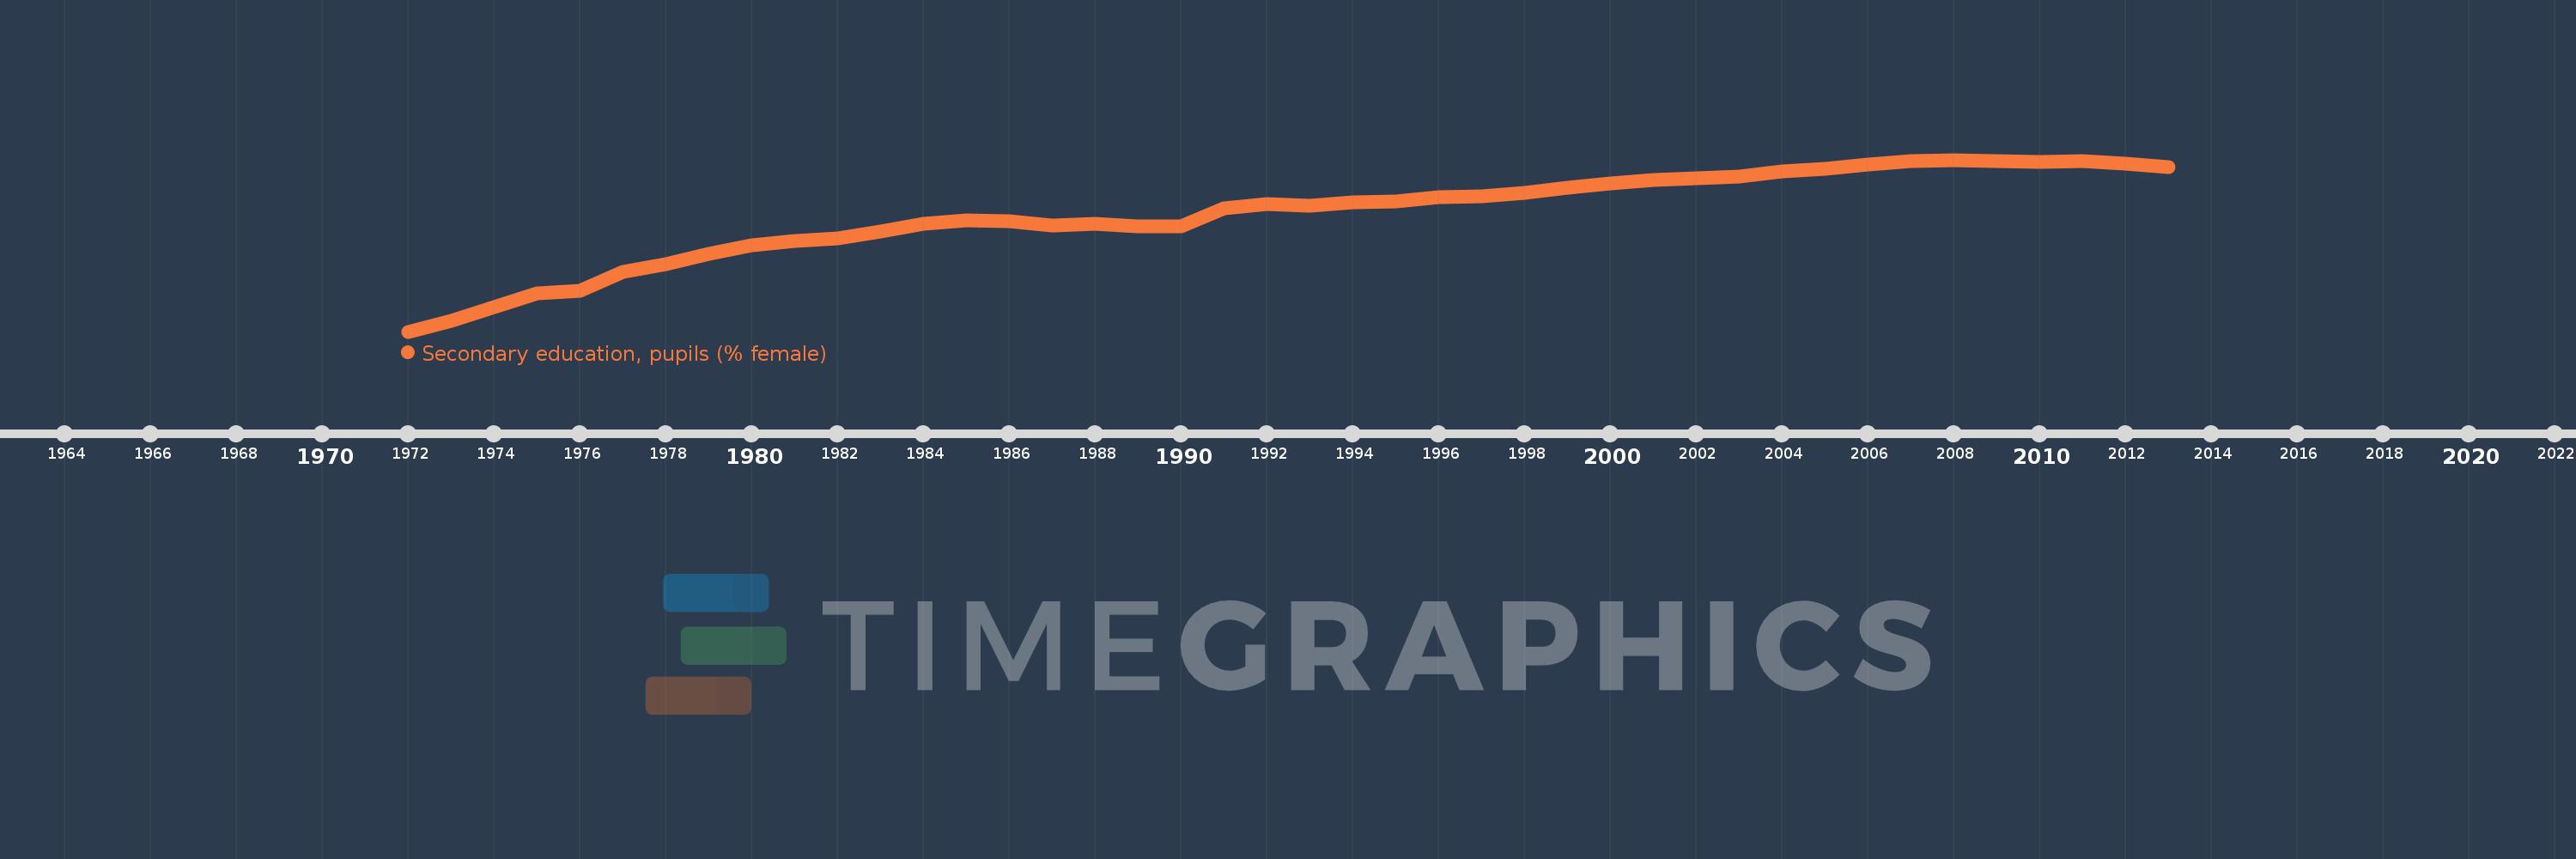
Secondary education, pupils (% female)
2013,2012,2011,2010,2009,2008,2007,2006,2005,2004,2003,2002,2001,2000,1999,1998,1997,1996,1995,1994,1993,1992,1991,1990,1989,1988,1987,1986,1985,1984,1983,1982,1981,1980,1979,1978,1977,1976,1975,1973,1972
Estas estadísticas en otros países:
AfghanistanAlbaniaAlgeriaAndorraAngolaAntigua and BarbudaArab WorldArgentinaArmeniaArubaAustraliaAustriaAzerbaijanBahamas, TheBahrainBangladeshBarbadosBelarusBelgiumBelizeBeninBermudaBhutanBoliviaBosnia and HerzegovinaBotswanaBrazilBritish Virgin IslandsBrunei DarussalamBulgariaBurkina FasoBurundiCabo VerdeCambodiaCameroonCanadaCaribbean small statesCayman IslandsCentral African RepublicCentral Europe and the BalticsChadChileChinaColombiaComorosCongo, Dem. Rep.Congo, Rep.Costa RicaCote d'IvoireCroatiaCubaCuracaoCyprusCzech RepublicDenmarkDjiboutiDominicaDominican RepublicEarly-demographic dividendEast Asia & PacificEast Asia & Pacific (excluding high income)East Asia & Pacific (IDA & IBRD countries)EcuadorEgypt, Arab Rep.El SalvadorEquatorial GuineaEritreaEstoniaEthiopiaEuro areaEurope & Central AsiaEurope & Central Asia (excluding high income)Europe & Central Asia (IDA & IBRD countries)European UnionFijiFinlandFragile and conflict affected situationsFranceGabonGambia, TheGeorgiaGermanyGhanaGibraltarGreeceGrenadaGuatemalaGuineaGuinea-BissauGuyanaHeavily indebted poor countries (HIPC)High incomeHondurasHong Kong SAR, ChinaHungaryIBRD onlyIcelandIDA & IBRD totalIDA blendIDA onlyIDA totalIndiaIndonesiaIran, Islamic Rep.IraqIrelandIsraelItalyJamaicaJapanJordanKazakhstanKenyaKiribatiKorea, Dem. People’s Rep.Korea, Rep.KuwaitKyrgyz RepublicLao PDRLate-demographic dividendLatin America & Caribbean Latin America & Caribbean (excluding high income)Latin America & the Caribbean (IDA & IBRD countries)LatviaLeast developed countries: UN classificationLebanonLesothoLiberiaLibyaLiechtensteinLithuaniaLow & middle incomeLow incomeLower middle incomeLuxembourgMacao SAR, ChinaMacedonia, FYRMadagascarMalawiMalaysiaMaldivesMaliMaltaMarshall IslandsMauritaniaMauritiusMexicoMicronesia, Fed. Sts.Middle East & North AfricaMiddle East & North Africa (excluding high income)Middle East & North Africa (IDA & IBRD countries)Middle incomeMoldovaMonacoMongoliaMontenegroMoroccoMozambiqueMyanmarNamibiaNauruNepalNetherlandsNew ZealandNicaraguaNigerNigeriaNorth AmericaNorwayOECD membersOmanOther small statesPacific island small statesPakistanPalauPanamaPapua New GuineaParaguayPeruPhilippinesPolandPortugalPost-demographic dividendPre-demographic dividendPuerto RicoQatarRomaniaRussian FederationRwandaSamoaSan MarinoSao Tome and PrincipeSaudi ArabiaSenegalSerbiaSeychellesSierra LeoneSingaporeSint Maarten (Dutch part)Slovak RepublicSloveniaSmall statesSolomon IslandsSomaliaSouth AfricaSouth AsiaSouth Asia (IDA & IBRD)SpainSri LankaSt. Kitts and NevisSt. LuciaSt. Vincent and the GrenadinesSub-Saharan Africa Sub-Saharan Africa (excluding high income)Sub-Saharan Africa (IDA & IBRD countries)SudanSurinameSwazilandSwedenSwitzerlandSyrian Arab RepublicTajikistanTanzaniaThailandTimor-LesteTogoTongaTrinidad and TobagoTunisiaTurkeyTurkmenistanTurks and Caicos IslandsTuvaluUgandaUkraineUnited Arab EmiratesUnited KingdomUnited StatesUpper middle incomeUruguayUzbekistanVanuatuVenezuela, RBVietnamWest Bank and GazaWorldYemen, Rep.ZambiaZimbabwe línea de tiempo (timeline):
En esta escala de tiempo se presenta un gráfico de 1972 y 2013 de Morocco. Los datos de 1971 están ausentes. El número de observaciones reales por fecha: 41.
Fuente (nombre):
Indicadores del desarrollo mundial
Fuente (organización):
United Nations Educational, Scientific, and Cultural Organization (UNESCO) Institute for Statistics.
Categorías:
Education, Gender
Se ha actualizado:
23 abr 2017 año
Los indicadores de los cambios de valor en los últimos años
Mínimo:
28.272
1 ene 1972 año
Máximo:
45.714
1 ene 2008 año
A la fecha de observación
Valor
Cambio absoluto
El cambio con respecto al valor anterior
1 ene 1972 año
28.272
+28.272
0.0%
1 ene 1973 año
29.355
+1.083
3.83%
1 ene 1975 año
32.14
+2.785
9.49%
1 ene 1976 año
32.452
+0.313
0.97%
1 ene 1977 año
34.322
+1.869
5.76%
1 ene 1978 año
35.095
+0.773
2.25%
1 ene 1979 año
36.18
+1.085
3.09%
1 ene 1980 año
37.019
+0.84
2.32%
1 ene 1981 año
37.484
+0.465
1.26%
1 ene 1982 año
37.719
+0.235
0.63%
1 ene 1983 año
38.466
+0.746
1.98%
1 ene 1984 año
39.215
+0.749
1.95%
1 ene 1985 año
39.589
+0.374
0.95%
1 ene 1986 año
39.479
-0.11
-0.28%
1 ene 1987 año
39.043
-0.436
-1.11%
1 ene 1988 año
39.194
+0.151
0.39%
1 ene 1989 año
38.941
-0.252
-0.64%
1 ene 1990 año
38.962
+0.02
0.05%
1 ene 1991 año
40.822
+1.86
4.77%
1 ene 1992 año
41.248
+0.426
1.04%
1 ene 1993 año
41.01
-0.237
-0.58%
1 ene 1994 año
41.367
+0.356
0.87%
1 ene 1995 año
41.49
+0.123
0.3%
1 ene 1996 año
41.883
+0.393
0.95%
1 ene 1997 año
41.969
+0.086
0.21%
1 ene 1998 año
42.351
+0.383
0.91%
1 ene 1999 año
42.873
+0.521
1.23%
1 ene 2000 año
43.359
+0.487
1.14%
1 ene 2001 año
43.67
+0.311
0.72%
1 ene 2002 año
43.826
+0.156
0.36%
1 ene 2003 año
44.04
+0.214
0.49%
1 ene 2004 año
44.517
+0.477
1.08%
1 ene 2005 año
44.827
+0.31
0.7%
1 ene 2006 año
45.237
+0.41
0.91%
1 ene 2007 año
45.553
+0.316
0.7%
1 ene 2008 año
45.714
+0.161
0.35%
1 ene 2009 año
45.591
-0.123
-0.27%
1 ene 2010 año
45.513
-0.078
-0.17%
1 ene 2011 año
45.587
+0.074
0.16%
1 ene 2012 año
45.282
-0.305
-0.67%
1 ene 2013 año
44.972
-0.309
-0.68%
Ranking de los países por los datos estadísticos actuales


Comentarios: