29
/es/
es
AIzaSyAYiBZKx7MnpbEhh9jyipgxe19OcubqV5w
April 1, 2024
209765
New Zealand
NZL
true
2
1
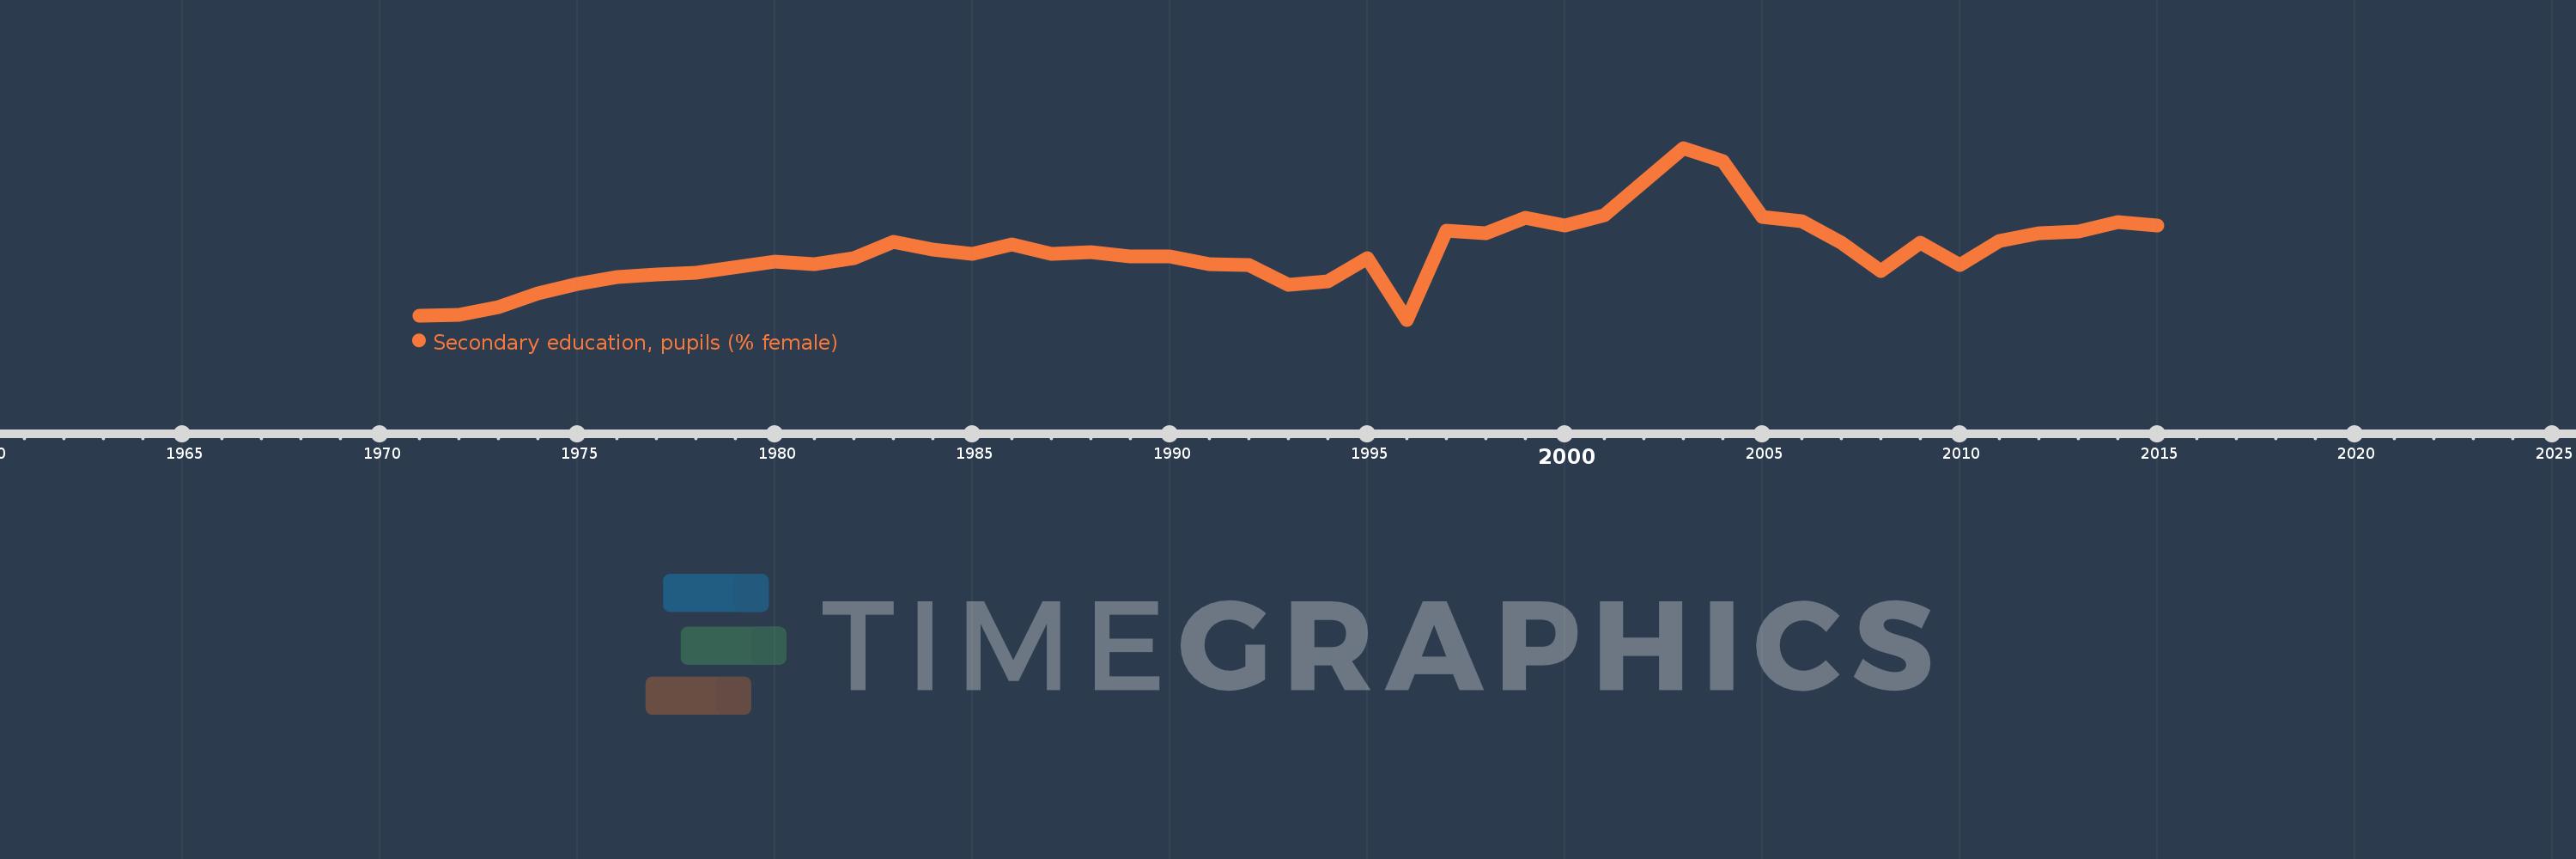
Secondary education, pupils (% female)
2015,2014,2013,2012,2011,2010,2009,2008,2007,2006,2005,2004,2003,2001,2000,1999,1998,1997,1996,1995,1994,1993,1992,1991,1990,1989,1988,1987,1986,1985,1984,1983,1982,1981,1980,1978,1977,1976,1975,1974,1973,1972,1971
Estas estadísticas en otros países:
AfghanistanAlbaniaAlgeriaAndorraAngolaAntigua and BarbudaArab WorldArgentinaArmeniaArubaAustraliaAustriaAzerbaijanBahamas, TheBahrainBangladeshBarbadosBelarusBelgiumBelizeBeninBermudaBhutanBoliviaBosnia and HerzegovinaBotswanaBrazilBritish Virgin IslandsBrunei DarussalamBulgariaBurkina FasoBurundiCabo VerdeCambodiaCameroonCanadaCaribbean small statesCayman IslandsCentral African RepublicCentral Europe and the BalticsChadChileChinaColombiaComorosCongo, Dem. Rep.Congo, Rep.Costa RicaCote d'IvoireCroatiaCubaCuracaoCyprusCzech RepublicDenmarkDjiboutiDominicaDominican RepublicEarly-demographic dividendEast Asia & PacificEast Asia & Pacific (excluding high income)East Asia & Pacific (IDA & IBRD countries)EcuadorEgypt, Arab Rep.El SalvadorEquatorial GuineaEritreaEstoniaEthiopiaEuro areaEurope & Central AsiaEurope & Central Asia (excluding high income)Europe & Central Asia (IDA & IBRD countries)European UnionFijiFinlandFragile and conflict affected situationsFranceGabonGambia, TheGeorgiaGermanyGhanaGibraltarGreeceGrenadaGuatemalaGuineaGuinea-BissauGuyanaHeavily indebted poor countries (HIPC)High incomeHondurasHong Kong SAR, ChinaHungaryIBRD onlyIcelandIDA & IBRD totalIDA blendIDA onlyIDA totalIndiaIndonesiaIran, Islamic Rep.IraqIrelandIsraelItalyJamaicaJapanJordanKazakhstanKenyaKiribatiKorea, Dem. People’s Rep.Korea, Rep.KuwaitKyrgyz RepublicLao PDRLate-demographic dividendLatin America & Caribbean Latin America & Caribbean (excluding high income)Latin America & the Caribbean (IDA & IBRD countries)LatviaLeast developed countries: UN classificationLebanonLesothoLiberiaLibyaLiechtensteinLithuaniaLow & middle incomeLow incomeLower middle incomeLuxembourgMacao SAR, ChinaMacedonia, FYRMadagascarMalawiMalaysiaMaldivesMaliMaltaMarshall IslandsMauritaniaMauritiusMexicoMicronesia, Fed. Sts.Middle East & North AfricaMiddle East & North Africa (excluding high income)Middle East & North Africa (IDA & IBRD countries)Middle incomeMoldovaMonacoMongoliaMontenegroMoroccoMozambiqueMyanmarNamibiaNauruNepalNetherlandsNew ZealandNicaraguaNigerNigeriaNorth AmericaNorwayOECD membersOmanOther small statesPacific island small statesPakistanPalauPanamaPapua New GuineaParaguayPeruPhilippinesPolandPortugalPost-demographic dividendPre-demographic dividendPuerto RicoQatarRomaniaRussian FederationRwandaSamoaSan MarinoSao Tome and PrincipeSaudi ArabiaSenegalSerbiaSeychellesSierra LeoneSingaporeSint Maarten (Dutch part)Slovak RepublicSloveniaSmall statesSolomon IslandsSomaliaSouth AfricaSouth AsiaSouth Asia (IDA & IBRD)SpainSri LankaSt. Kitts and NevisSt. LuciaSt. Vincent and the GrenadinesSub-Saharan Africa Sub-Saharan Africa (excluding high income)Sub-Saharan Africa (IDA & IBRD countries)SudanSurinameSwazilandSwedenSwitzerlandSyrian Arab RepublicTajikistanTanzaniaThailandTimor-LesteTogoTongaTrinidad and TobagoTunisiaTurkeyTurkmenistanTurks and Caicos IslandsTuvaluUgandaUkraineUnited Arab EmiratesUnited KingdomUnited StatesUpper middle incomeUruguayUzbekistanVanuatuVenezuela, RBVietnamWest Bank and GazaWorldYemen, Rep.ZambiaZimbabwe línea de tiempo (timeline):
En esta escala de tiempo se presenta un gráfico de 1971 y 2015 de New Zealand. Los datos de 1970 están ausentes. El número de observaciones reales por fecha: 43.
Fuente (nombre):
Indicadores del desarrollo mundial
Fuente (organización):
United Nations Educational, Scientific, and Cultural Organization (UNESCO) Institute for Statistics.
Categorías:
Education, Gender
Se ha actualizado:
23 abr 2017 año
Los indicadores de los cambios de valor en los últimos años
Mínimo:
48.392
1 ene 1996 año
Máximo:
51.581
1 ene 2003 año
A la fecha de observación
Valor
Cambio absoluto
El cambio con respecto al valor anterior
1 ene 1971 año
48.459
+48.459
0.0%
1 ene 1972 año
48.481
+0.022
0.05%
1 ene 1973 año
48.619
+0.138
0.28%
1 ene 1974 año
48.877
+0.258
0.53%
1 ene 1975 año
49.049
+0.173
0.35%
1 ene 1976 año
49.188
+0.138
0.28%
1 ene 1977 año
49.228
+0.04
0.08%
1 ene 1978 año
49.262
+0.034
0.07%
1 ene 1980 año
49.476
+0.214
0.43%
1 ene 1981 año
49.422
-0.054
-0.11%
1 ene 1982 año
49.542
+0.121
0.24%
1 ene 1983 año
49.837
+0.295
0.6%
1 ene 1984 año
49.691
-0.147
-0.29%
1 ene 1985 año
49.62
-0.071
-0.14%
1 ene 1986 año
49.794
+0.174
0.35%
1 ene 1987 año
49.609
-0.185
-0.37%
1 ene 1988 año
49.639
+0.03
0.06%
1 ene 1989 año
49.56
-0.08
-0.16%
1 ene 1990 año
49.561
+0.001
0.0%
1 ene 1991 año
49.427
-0.134
-0.27%
1 ene 1992 año
49.404
-0.022
-0.05%
1 ene 1993 año
49.034
-0.371
-0.75%
1 ene 1994 año
49.11
+0.077
0.16%
1 ene 1995 año
49.542
+0.431
0.88%
1 ene 1996 año
48.392
-1.149
-2.32%
1 ene 1997 año
50.043
+1.65
3.41%
1 ene 1998 año
49.99
-0.053
-0.11%
1 ene 1999 año
50.285
+0.295
0.59%
1 ene 2000 año
50.143
-0.142
-0.28%
1 ene 2001 año
50.325
+0.181
0.36%
1 ene 2003 año
51.581
+1.256
2.5%
1 ene 2004 año
51.343
-0.238
-0.46%
1 ene 2005 año
50.301
-1.042
-2.03%
1 ene 2006 año
50.216
-0.085
-0.17%
1 ene 2007 año
49.829
-0.387
-0.77%
1 ene 2008 año
49.301
-0.528
-1.06%
1 ene 2009 año
49.829
+0.528
1.07%
1 ene 2010 año
49.406
-0.424
-0.85%
1 ene 2011 año
49.852
+0.446
0.9%
1 ene 2012 año
49.994
+0.141
0.28%
1 ene 2013 año
50.03
+0.036
0.07%
1 ene 2014 año
50.203
+0.173
0.35%
1 ene 2015 año
50.141
-0.063
-0.12%
Ranking de los países por los datos estadísticos actuales


Comentarios: