29
/es/
es
AIzaSyAYiBZKx7MnpbEhh9jyipgxe19OcubqV5w
April 1, 2024
215793
Oman
OMN
true
2
1
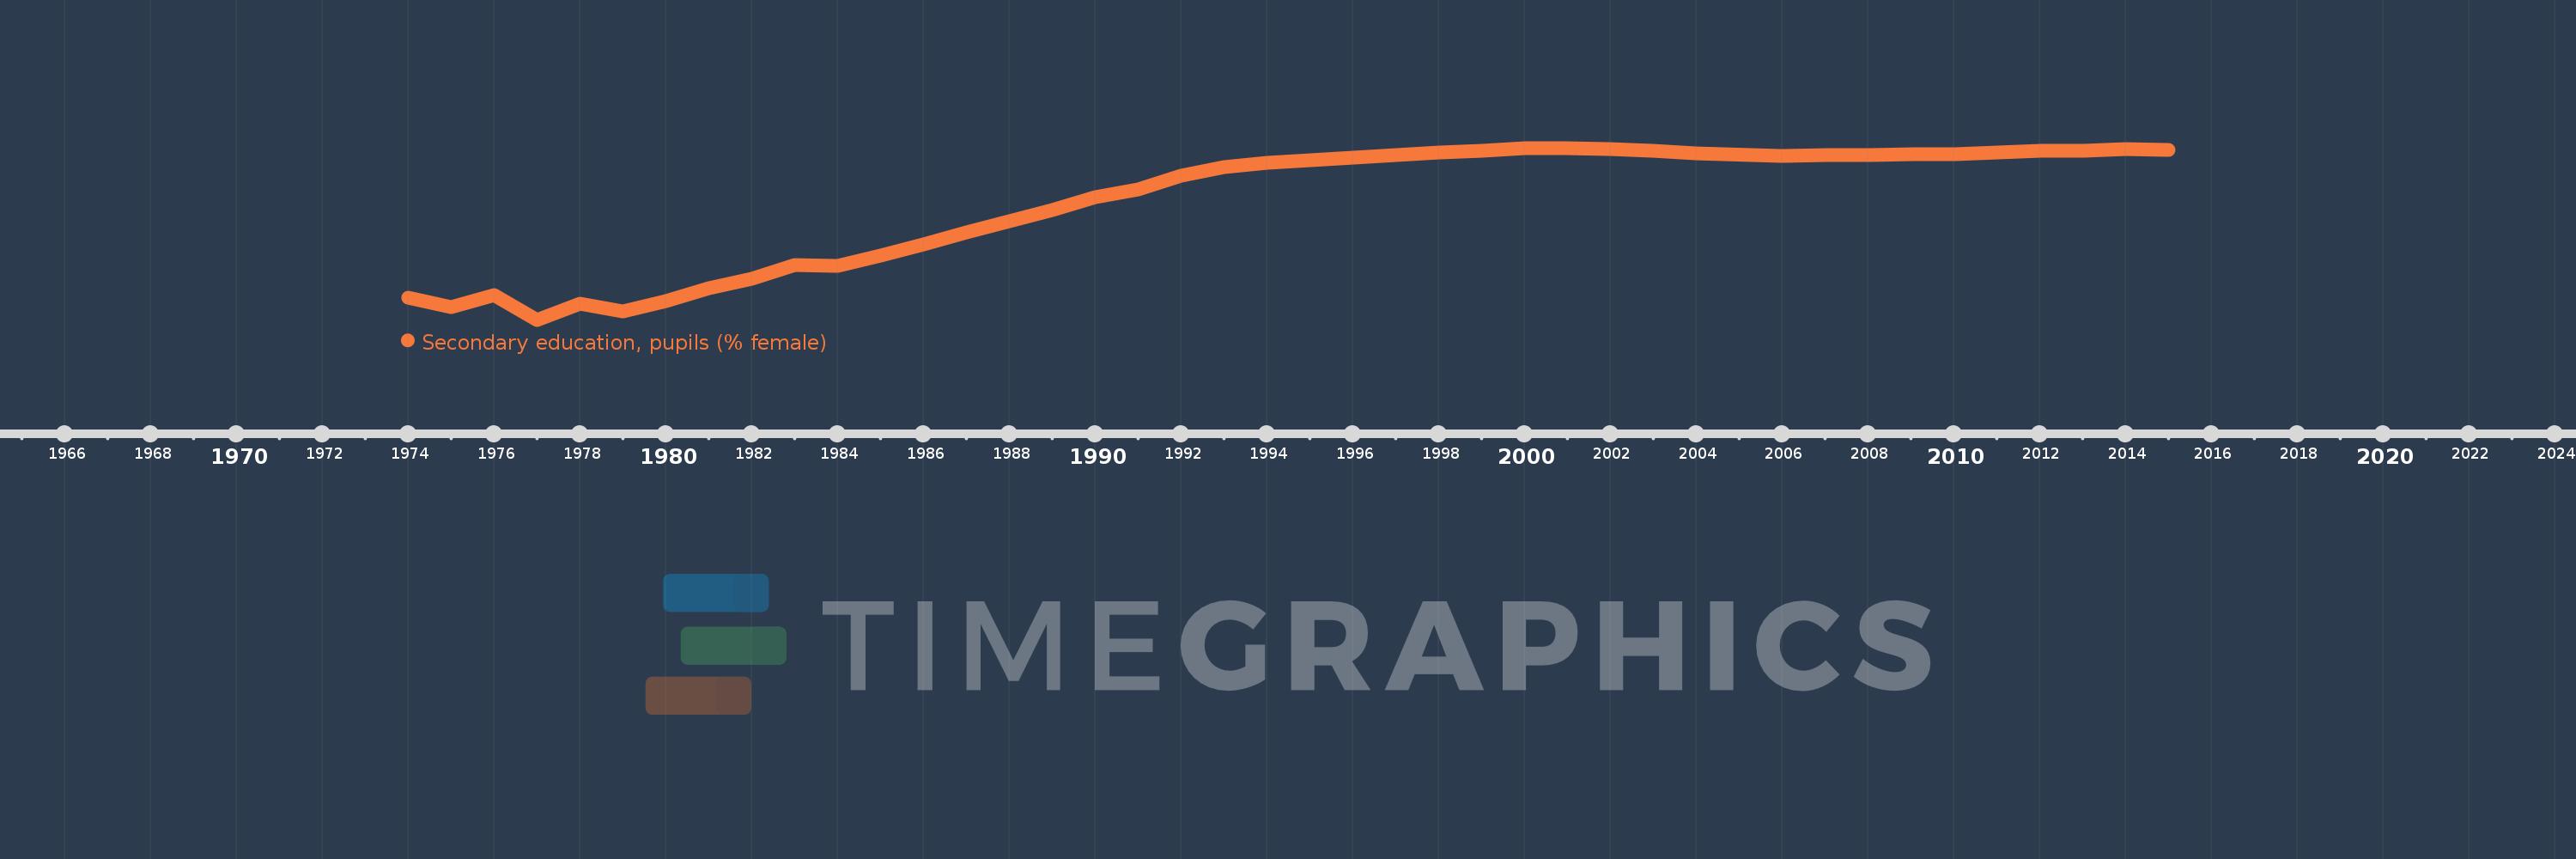
Secondary education, pupils (% female)
2015,2014,2013,2012,2010,2009,2008,2007,2006,2004,2003,2002,2001,2000,1999,1998,1997,1996,1995,1994,1993,1992,1991,1990,1989,1988,1987,1986,1985,1984,1983,1982,1981,1980,1979,1978,1977,1976,1975,1974
Estas estadísticas en otros países:
AfghanistanAlbaniaAlgeriaAndorraAngolaAntigua and BarbudaArab WorldArgentinaArmeniaArubaAustraliaAustriaAzerbaijanBahamas, TheBahrainBangladeshBarbadosBelarusBelgiumBelizeBeninBermudaBhutanBoliviaBosnia and HerzegovinaBotswanaBrazilBritish Virgin IslandsBrunei DarussalamBulgariaBurkina FasoBurundiCabo VerdeCambodiaCameroonCanadaCaribbean small statesCayman IslandsCentral African RepublicCentral Europe and the BalticsChadChileChinaColombiaComorosCongo, Dem. Rep.Congo, Rep.Costa RicaCote d'IvoireCroatiaCubaCuracaoCyprusCzech RepublicDenmarkDjiboutiDominicaDominican RepublicEarly-demographic dividendEast Asia & PacificEast Asia & Pacific (excluding high income)East Asia & Pacific (IDA & IBRD countries)EcuadorEgypt, Arab Rep.El SalvadorEquatorial GuineaEritreaEstoniaEthiopiaEuro areaEurope & Central AsiaEurope & Central Asia (excluding high income)Europe & Central Asia (IDA & IBRD countries)European UnionFijiFinlandFragile and conflict affected situationsFranceGabonGambia, TheGeorgiaGermanyGhanaGibraltarGreeceGrenadaGuatemalaGuineaGuinea-BissauGuyanaHeavily indebted poor countries (HIPC)High incomeHondurasHong Kong SAR, ChinaHungaryIBRD onlyIcelandIDA & IBRD totalIDA blendIDA onlyIDA totalIndiaIndonesiaIran, Islamic Rep.IraqIrelandIsraelItalyJamaicaJapanJordanKazakhstanKenyaKiribatiKorea, Dem. People’s Rep.Korea, Rep.KuwaitKyrgyz RepublicLao PDRLate-demographic dividendLatin America & Caribbean Latin America & Caribbean (excluding high income)Latin America & the Caribbean (IDA & IBRD countries)LatviaLeast developed countries: UN classificationLebanonLesothoLiberiaLibyaLiechtensteinLithuaniaLow & middle incomeLow incomeLower middle incomeLuxembourgMacao SAR, ChinaMacedonia, FYRMadagascarMalawiMalaysiaMaldivesMaliMaltaMarshall IslandsMauritaniaMauritiusMexicoMicronesia, Fed. Sts.Middle East & North AfricaMiddle East & North Africa (excluding high income)Middle East & North Africa (IDA & IBRD countries)Middle incomeMoldovaMonacoMongoliaMontenegroMoroccoMozambiqueMyanmarNamibiaNauruNepalNetherlandsNew ZealandNicaraguaNigerNigeriaNorth AmericaNorwayOECD membersOmanOther small statesPacific island small statesPakistanPalauPanamaPapua New GuineaParaguayPeruPhilippinesPolandPortugalPost-demographic dividendPre-demographic dividendPuerto RicoQatarRomaniaRussian FederationRwandaSamoaSan MarinoSao Tome and PrincipeSaudi ArabiaSenegalSerbiaSeychellesSierra LeoneSingaporeSint Maarten (Dutch part)Slovak RepublicSloveniaSmall statesSolomon IslandsSomaliaSouth AfricaSouth AsiaSouth Asia (IDA & IBRD)SpainSri LankaSt. Kitts and NevisSt. LuciaSt. Vincent and the GrenadinesSub-Saharan Africa Sub-Saharan Africa (excluding high income)Sub-Saharan Africa (IDA & IBRD countries)SudanSurinameSwazilandSwedenSwitzerlandSyrian Arab RepublicTajikistanTanzaniaThailandTimor-LesteTogoTongaTrinidad and TobagoTunisiaTurkeyTurkmenistanTurks and Caicos IslandsTuvaluUgandaUkraineUnited Arab EmiratesUnited KingdomUnited StatesUpper middle incomeUruguayUzbekistanVanuatuVenezuela, RBVietnamWest Bank and GazaWorldYemen, Rep.ZambiaZimbabwe línea de tiempo (timeline):
En esta escala de tiempo se presenta un gráfico de 1974 y 2015 de Oman. Los datos de 1973 están ausentes. El número de observaciones reales por fecha: 40.
Fuente (nombre):
Indicadores del desarrollo mundial
Fuente (organización):
United Nations Educational, Scientific, and Cultural Organization (UNESCO) Institute for Statistics.
Categorías:
Education, Gender
Se ha actualizado:
23 abr 2017 año
Los indicadores de los cambios de valor en los últimos años
Mínimo:
16.461
1 ene 1977 año
Máximo:
49.144
1 ene 2000 año
A la fecha de observación
Valor
Cambio absoluto
El cambio con respecto al valor anterior
1 ene 1974 año
20.619
+20.619
0.0%
1 ene 1975 año
18.854
-1.764
-8.56%
1 ene 1976 año
21.162
+2.307
12.24%
1 ene 1977 año
16.461
-4.701
-22.21%
1 ene 1978 año
19.504
+3.042
18.48%
1 ene 1979 año
18.098
-1.406
-7.21%
1 ene 1980 año
20.038
+1.939
10.72%
1 ene 1981 año
22.433
+2.395
11.95%
1 ene 1982 año
24.189
+1.757
7.83%
1 ene 1983 año
26.929
+2.74
11.33%
1 ene 1984 año
26.657
-0.272
-1.01%
1 ene 1985 año
28.653
+1.995
7.48%
1 ene 1986 año
30.856
+2.203
7.69%
1 ene 1987 año
33.07
+2.214
7.18%
1 ene 1988 año
35.151
+2.08
6.29%
1 ene 1989 año
37.364
+2.213
6.29%
1 ene 1990 año
39.699
+2.335
6.25%
1 ene 1991 año
41.32
+1.621
4.08%
1 ene 1992 año
43.899
+2.579
6.24%
1 ene 1993 año
45.445
+1.546
3.52%
1 ene 1994 año
46.394
+0.949
2.09%
1 ene 1995 año
46.856
+0.462
1.0%
1 ene 1996 año
47.36
+0.503
1.07%
1 ene 1997 año
47.767
+0.408
0.86%
1 ene 1998 año
48.286
+0.519
1.09%
1 ene 1999 año
48.581
+0.295
0.61%
1 ene 2000 año
49.144
+0.563
1.16%
1 ene 2001 año
49.097
-0.047
-0.1%
1 ene 2002 año
48.917
-0.179
-0.37%
1 ene 2003 año
48.623
-0.294
-0.6%
1 ene 2004 año
48.097
-0.526
-1.08%
1 ene 2006 año
47.686
-0.411
-0.86%
1 ene 2007 año
47.772
+0.086
0.18%
1 ene 2008 año
47.791
+0.019
0.04%
1 ene 2009 año
48.03
+0.239
0.5%
1 ene 2010 año
48.003
-0.027
-0.06%
1 ene 2012 año
48.645
+0.642
1.34%
1 ene 2013 año
48.524
-0.121
-0.25%
1 ene 2014 año
48.969
+0.444
0.92%
1 ene 2015 año
48.844
-0.125
-0.26%
Ranking de los países por los datos estadísticos actuales


Comentarios: