29
/es/
es
AIzaSyAYiBZKx7MnpbEhh9jyipgxe19OcubqV5w
April 1, 2024
35375
Heavily indebted poor countries (HIPC)
HPC
false
2
1
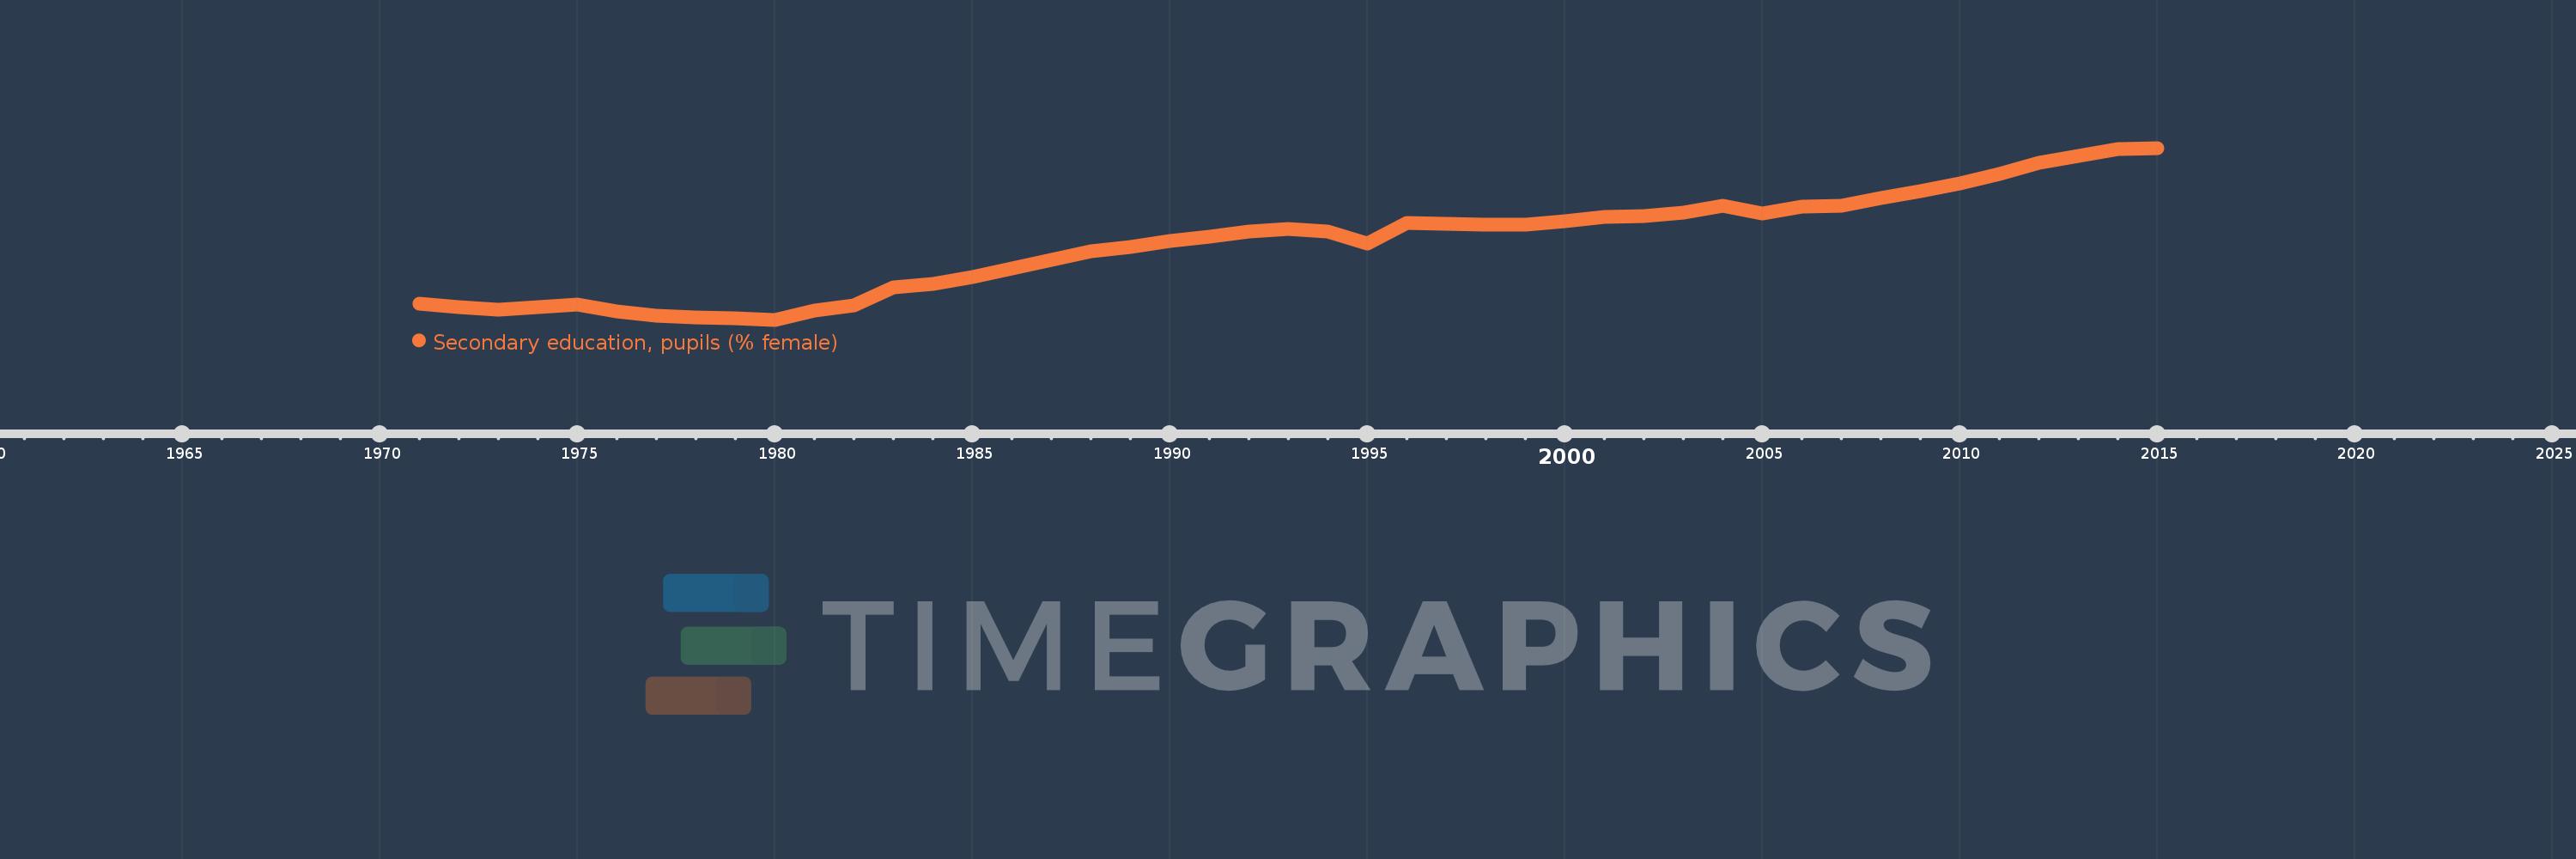
Secondary education, pupils (% female)
2015,2014,2013,2012,2011,2010,2009,2008,2007,2006,2005,2004,2003,2002,2001,2000,1999,1998,1997,1996,1995,1994,1993,1992,1991,1990,1989,1988,1987,1986,1985,1984,1983,1982,1981,1980,1979,1978,1977,1976,1975,1974,1973,1972,1971
Estas estadísticas en otros países:
AfghanistanAlbaniaAlgeriaAndorraAngolaAntigua and BarbudaArab WorldArgentinaArmeniaArubaAustraliaAustriaAzerbaijanBahamas, TheBahrainBangladeshBarbadosBelarusBelgiumBelizeBeninBermudaBhutanBoliviaBosnia and HerzegovinaBotswanaBrazilBritish Virgin IslandsBrunei DarussalamBulgariaBurkina FasoBurundiCabo VerdeCambodiaCameroonCanadaCaribbean small statesCayman IslandsCentral African RepublicCentral Europe and the BalticsChadChileChinaColombiaComorosCongo, Dem. Rep.Congo, Rep.Costa RicaCote d'IvoireCroatiaCubaCuracaoCyprusCzech RepublicDenmarkDjiboutiDominicaDominican RepublicEarly-demographic dividendEast Asia & PacificEast Asia & Pacific (excluding high income)East Asia & Pacific (IDA & IBRD countries)EcuadorEgypt, Arab Rep.El SalvadorEquatorial GuineaEritreaEstoniaEthiopiaEuro areaEurope & Central AsiaEurope & Central Asia (excluding high income)Europe & Central Asia (IDA & IBRD countries)European UnionFijiFinlandFragile and conflict affected situationsFranceGabonGambia, TheGeorgiaGermanyGhanaGibraltarGreeceGrenadaGuatemalaGuineaGuinea-BissauGuyanaHeavily indebted poor countries (HIPC)High incomeHondurasHong Kong SAR, ChinaHungaryIBRD onlyIcelandIDA & IBRD totalIDA blendIDA onlyIDA totalIndiaIndonesiaIran, Islamic Rep.IraqIrelandIsraelItalyJamaicaJapanJordanKazakhstanKenyaKiribatiKorea, Dem. People’s Rep.Korea, Rep.KuwaitKyrgyz RepublicLao PDRLate-demographic dividendLatin America & Caribbean Latin America & Caribbean (excluding high income)Latin America & the Caribbean (IDA & IBRD countries)LatviaLeast developed countries: UN classificationLebanonLesothoLiberiaLibyaLiechtensteinLithuaniaLow & middle incomeLow incomeLower middle incomeLuxembourgMacao SAR, ChinaMacedonia, FYRMadagascarMalawiMalaysiaMaldivesMaliMaltaMarshall IslandsMauritaniaMauritiusMexicoMicronesia, Fed. Sts.Middle East & North AfricaMiddle East & North Africa (excluding high income)Middle East & North Africa (IDA & IBRD countries)Middle incomeMoldovaMonacoMongoliaMontenegroMoroccoMozambiqueMyanmarNamibiaNauruNepalNetherlandsNew ZealandNicaraguaNigerNigeriaNorth AmericaNorwayOECD membersOmanOther small statesPacific island small statesPakistanPalauPanamaPapua New GuineaParaguayPeruPhilippinesPolandPortugalPost-demographic dividendPre-demographic dividendPuerto RicoQatarRomaniaRussian FederationRwandaSamoaSan MarinoSao Tome and PrincipeSaudi ArabiaSenegalSerbiaSeychellesSierra LeoneSingaporeSint Maarten (Dutch part)Slovak RepublicSloveniaSmall statesSolomon IslandsSomaliaSouth AfricaSouth AsiaSouth Asia (IDA & IBRD)SpainSri LankaSt. Kitts and NevisSt. LuciaSt. Vincent and the GrenadinesSub-Saharan Africa Sub-Saharan Africa (excluding high income)Sub-Saharan Africa (IDA & IBRD countries)SudanSurinameSwazilandSwedenSwitzerlandSyrian Arab RepublicTajikistanTanzaniaThailandTimor-LesteTogoTongaTrinidad and TobagoTunisiaTurkeyTurkmenistanTurks and Caicos IslandsTuvaluUgandaUkraineUnited Arab EmiratesUnited KingdomUnited StatesUpper middle incomeUruguayUzbekistanVanuatuVenezuela, RBVietnamWest Bank and GazaWorldYemen, Rep.ZambiaZimbabwe línea de tiempo (timeline):
En esta escala de tiempo se presenta un gráfico de 1971 y 2015 de Heavily indebted poor countries (HIPC). Los datos de 1970 están ausentes. El número de observaciones reales por fecha: 45.
Fuente (nombre):
Indicadores del desarrollo mundial
Fuente (organización):
United Nations Educational, Scientific, and Cultural Organization (UNESCO) Institute for Statistics.
Categorías:
Education, Gender
Se ha actualizado:
23 abr 2017 año
Los indicadores de los cambios de valor en los últimos años
Mínimo:
35.148
1 ene 1980 año
Máximo:
44.33
1 ene 2015 año
A la fecha de observación
Valor
Cambio absoluto
El cambio con respecto al valor anterior
1 ene 1971 año
36.001
+36.001
0.0%
1 ene 1972 año
35.828
-0.173
-0.48%
1 ene 1973 año
35.685
-0.143
-0.4%
1 ene 1974 año
35.809
+0.124
0.35%
1 ene 1975 año
35.943
+0.134
0.37%
1 ene 1976 año
35.579
-0.364
-1.01%
1 ene 1977 año
35.374
-0.206
-0.58%
1 ene 1978 año
35.293
-0.081
-0.23%
1 ene 1979 año
35.239
-0.054
-0.15%
1 ene 1980 año
35.148
-0.091
-0.26%
1 ene 1981 año
35.622
+0.474
1.35%
1 ene 1982 año
35.915
+0.294
0.82%
1 ene 1983 año
36.879
+0.963
2.68%
1 ene 1984 año
37.079
+0.201
0.54%
1 ene 1985 año
37.44
+0.36
0.97%
1 ene 1986 año
37.879
+0.44
1.17%
1 ene 1987 año
38.331
+0.452
1.19%
1 ene 1988 año
38.815
+0.484
1.26%
1 ene 1989 año
39.053
+0.238
0.61%
1 ene 1990 año
39.353
+0.3
0.77%
1 ene 1991 año
39.594
+0.241
0.61%
1 ene 1992 año
39.88
+0.286
0.72%
1 ene 1993 año
40.006
+0.126
0.32%
1 ene 1994 año
39.871
-0.135
-0.34%
1 ene 1995 año
39.222
-0.649
-1.63%
1 ene 1996 año
40.321
+1.099
2.8%
1 ene 1997 año
40.284
-0.036
-0.09%
1 ene 1998 año
40.248
-0.036
-0.09%
1 ene 1999 año
40.21
-0.038
-0.09%
1 ene 2000 año
40.43
+0.219
0.55%
1 ene 2001 año
40.637
+0.207
0.51%
1 ene 2002 año
40.705
+0.069
0.17%
1 ene 2003 año
40.869
+0.164
0.4%
1 ene 2004 año
41.252
+0.384
0.94%
1 ene 2005 año
40.815
-0.438
-1.06%
1 ene 2006 año
41.189
+0.374
0.92%
1 ene 2007 año
41.24
+0.051
0.12%
1 ene 2008 año
41.64
+0.401
0.97%
1 ene 2009 año
42.033
+0.393
0.94%
1 ene 2010 año
42.418
+0.385
0.92%
1 ene 2011 año
42.937
+0.519
1.22%
1 ene 2012 año
43.531
+0.594
1.38%
1 ene 2013 año
43.89
+0.359
0.82%
1 ene 2014 año
44.282
+0.393
0.89%
1 ene 2015 año
44.33
+0.048
0.11%
Ranking de los países por los datos estadísticos actuales


Comentarios: