29
/es/
es
AIzaSyAYiBZKx7MnpbEhh9jyipgxe19OcubqV5w
April 1, 2024
52959
OECD members
OED
false
2
1
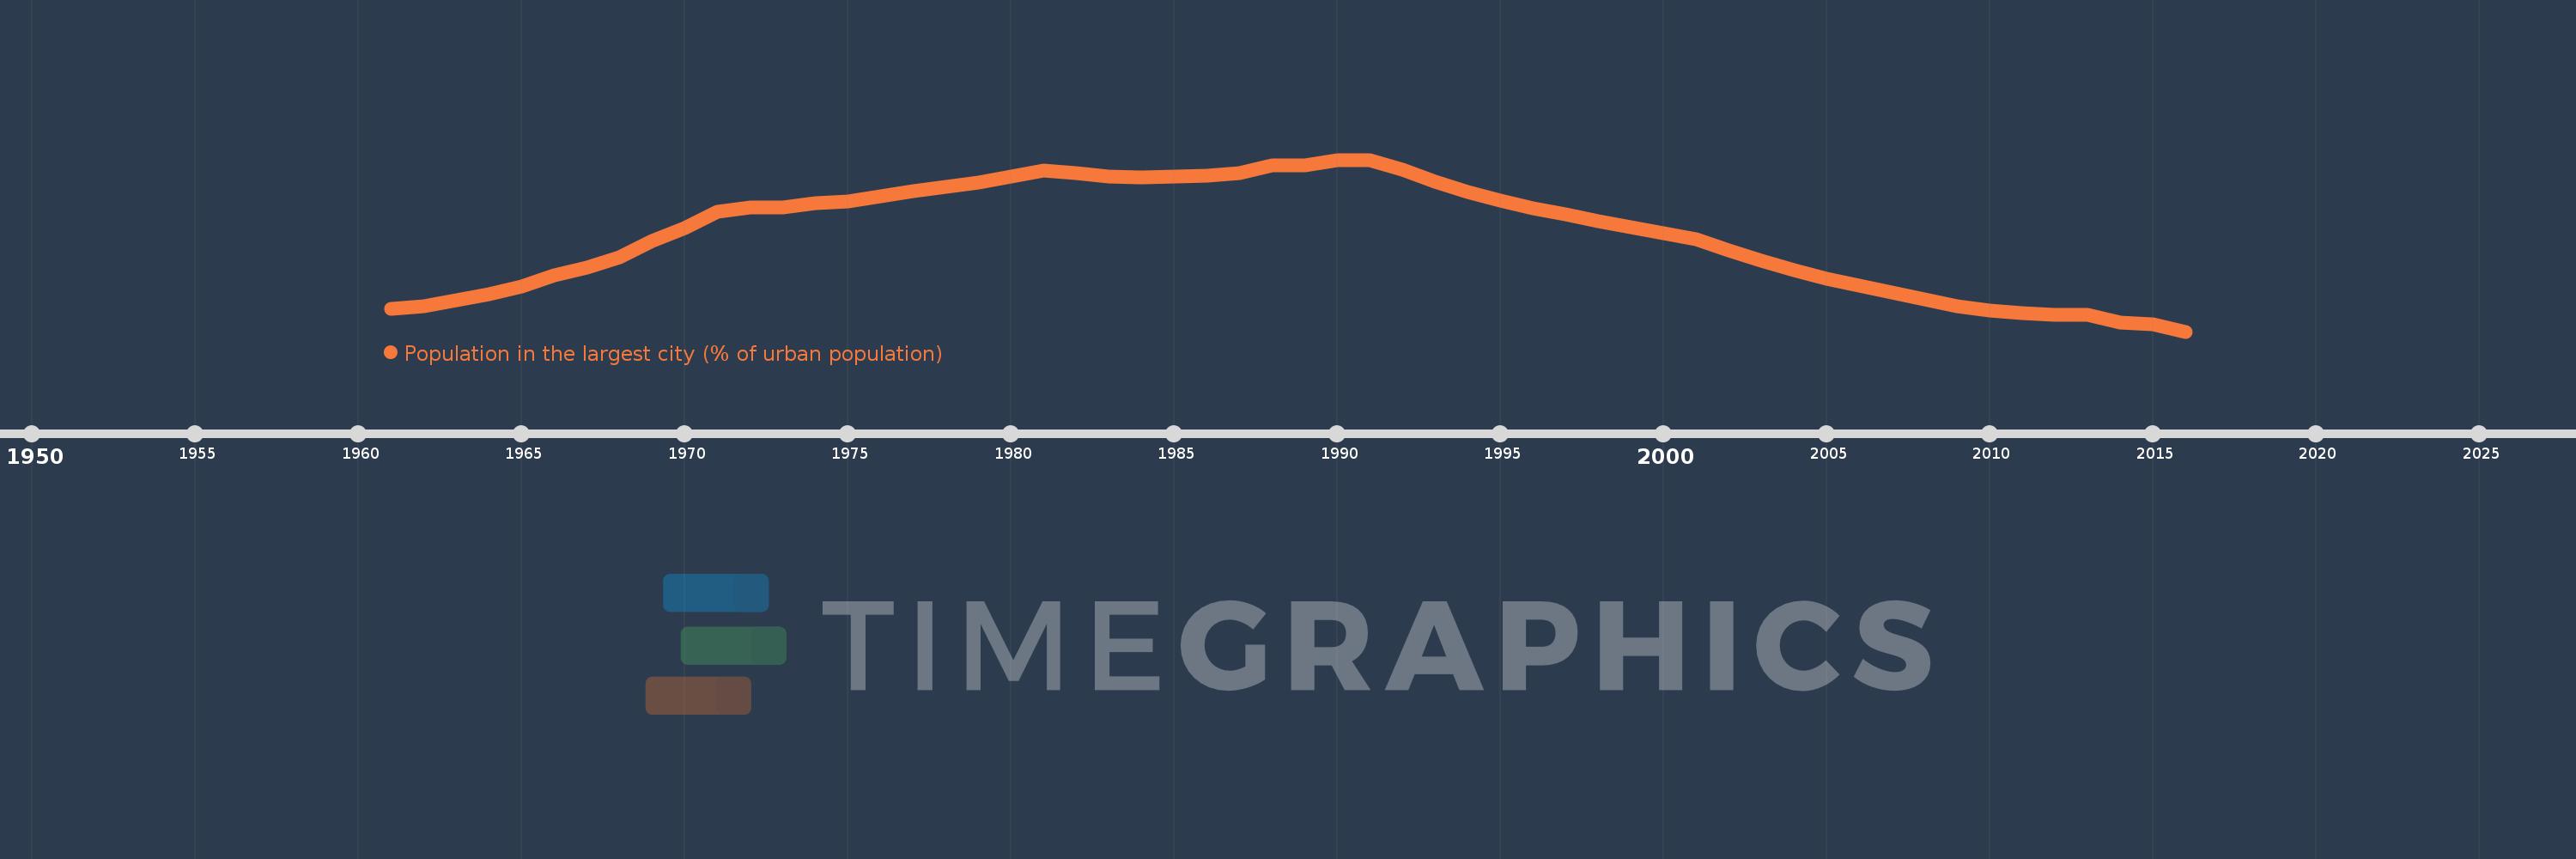
Population in the largest city (% of urban population)
2016,2015,2014,2013,2012,2011,2010,2009,2008,2007,2006,2005,2004,2003,2002,2001,2000,1999,1998,1997,1996,1995,1994,1993,1992,1991,1990,1989,1988,1987,1986,1985,1984,1983,1982,1981,1980,1979,1978,1977,1976,1975,1974,1973,1972,1971,1970,1969,1968,1967,1966,1965,1964,1963,1962,1961
Estas estadísticas en otros países:
AfghanistanAlbaniaAlgeriaAngolaArab WorldArgentinaArmeniaAustraliaAustriaAzerbaijanBahrainBangladeshBelarusBelgiumBeninBoliviaBosnia and HerzegovinaBrazilBulgariaBurkina FasoBurundiCambodiaCameroonCanadaCentral African RepublicCentral Europe and the BalticsChadChileChinaColombiaCongo, Dem. Rep.Congo, Rep.Costa RicaCote d'IvoireCroatiaCubaCzech RepublicDenmarkDjiboutiDominican RepublicEarly-demographic dividendEast Asia & PacificEast Asia & Pacific (excluding high income)East Asia & Pacific (IDA & IBRD countries)EcuadorEgypt, Arab Rep.El SalvadorEritreaEstoniaEthiopiaEuro areaEurope & Central AsiaEurope & Central Asia (excluding high income)Europe & Central Asia (IDA & IBRD countries)European UnionFinlandFragile and conflict affected situationsFranceGabonGambia, TheGeorgiaGermanyGhanaGreeceGuatemalaGuineaGuinea-BissauHaitiHeavily indebted poor countries (HIPC)High incomeHondurasHong Kong SAR, ChinaHungaryIBRD onlyIDA & IBRD totalIDA blendIDA onlyIDA totalIndiaIndonesiaIran, Islamic Rep.IraqIrelandIsraelItalyJamaicaJapanJordanKazakhstanKenyaKorea, Dem. People’s Rep.Korea, Rep.KuwaitKyrgyz RepublicLao PDRLate-demographic dividendLatin America & Caribbean Latin America & Caribbean (excluding high income)Latin America & the Caribbean (IDA & IBRD countries)LatviaLeast developed countries: UN classificationLebanonLiberiaLibyaLithuaniaLow & middle incomeLow incomeLower middle incomeMacao SAR, ChinaMacedonia, FYRMadagascarMalawiMalaysiaMaliMauritaniaMexicoMiddle East & North AfricaMiddle East & North Africa (excluding high income)Middle East & North Africa (IDA & IBRD countries)Middle incomeMoldovaMongoliaMoroccoMozambiqueMyanmarNamibiaNepalNetherlandsNew ZealandNicaraguaNigerNigeriaNorth AmericaNorwayOECD membersOmanPakistanPanamaPapua New GuineaParaguayPeruPhilippinesPolandPortugalPost-demographic dividendPre-demographic dividendPuerto RicoQatarRomaniaRussian FederationRwandaSaudi ArabiaSenegalSerbiaSierra LeoneSingaporeSlovak RepublicSomaliaSouth AfricaSouth AsiaSouth Asia (IDA & IBRD)South SudanSpainSri LankaSub-Saharan Africa Sub-Saharan Africa (excluding high income)Sub-Saharan Africa (IDA & IBRD countries)SudanSwedenSwitzerlandSyrian Arab RepublicTajikistanTanzaniaThailandTogoTunisiaTurkeyTurkmenistanUgandaUkraineUnited Arab EmiratesUnited KingdomUnited StatesUpper middle incomeUruguayUzbekistanVenezuela, RBVietnamWest Bank and GazaWorldYemen, Rep.ZambiaZimbabwe línea de tiempo (timeline):
En esta escala de tiempo se presenta un gráfico de 1961 y 2016 de OECD members. Los datos de 1960 están ausentes. El número de observaciones reales por fecha: 56.
Fuente (nombre):
Indicadores del desarrollo mundial
Fuente (organización):
United Nations, World Urbanization Prospects.
Categorías:
Urban Development
Se ha actualizado:
23 abr 2017 año
Los indicadores de los cambios de valor en los últimos años
Mínimo:
17.752
1 ene 2016 año
Máximo:
18.804
1 ene 1991 año
A la fecha de observación
Valor
Cambio absoluto
El cambio con respecto al valor anterior
1 ene 1961 año
17.893
+17.893
0.0%
1 ene 1962 año
17.905
+0.012
0.07%
1 ene 1963 año
17.943
+0.038
0.21%
1 ene 1964 año
17.979
+0.036
0.2%
1 ene 1965 año
18.029
+0.05
0.28%
1 ene 1966 año
18.096
+0.067
0.37%
1 ene 1967 año
18.145
+0.049
0.27%
1 ene 1968 año
18.207
+0.062
0.34%
1 ene 1969 año
18.307
+0.1
0.55%
1 ene 1970 año
18.386
+0.079
0.43%
1 ene 1971 año
18.486
+0.099
0.54%
1 ene 1972 año
18.513
+0.027
0.15%
1 ene 1973 año
18.51
-0.003
-0.02%
1 ene 1974 año
18.536
+0.027
0.14%
1 ene 1975 año
18.549
+0.013
0.07%
1 ene 1976 año
18.581
+0.032
0.17%
1 ene 1977 año
18.613
+0.033
0.18%
1 ene 1978 año
18.637
+0.024
0.13%
1 ene 1979 año
18.666
+0.028
0.15%
1 ene 1980 año
18.699
+0.034
0.18%
1 ene 1981 año
18.74
+0.041
0.22%
1 ene 1982 año
18.723
-0.017
-0.09%
1 ene 1983 año
18.703
-0.02
-0.11%
1 ene 1984 año
18.695
-0.008
-0.05%
1 ene 1985 año
18.7
+0.006
0.03%
1 ene 1986 año
18.709
+0.009
0.05%
1 ene 1987 año
18.724
+0.014
0.08%
1 ene 1988 año
18.772
+0.048
0.26%
1 ene 1989 año
18.771
-0.001
0.0%
1 ene 1990 año
18.8
+0.028
0.15%
1 ene 1991 año
18.804
+0.004
0.02%
1 ene 1992 año
18.746
-0.058
-0.31%
1 ene 1993 año
18.67
-0.076
-0.41%
1 ene 1994 año
18.606
-0.064
-0.34%
1 ene 1995 año
18.554
-0.052
-0.28%
1 ene 1996 año
18.508
-0.046
-0.25%
1 ene 1997 año
18.468
-0.04
-0.21%
1 ene 1998 año
18.429
-0.039
-0.21%
1 ene 1999 año
18.393
-0.036
-0.2%
1 ene 2000 año
18.356
-0.037
-0.2%
1 ene 2001 año
18.317
-0.04
-0.22%
1 ene 2002 año
18.249
-0.068
-0.37%
1 ene 2003 año
18.188
-0.061
-0.33%
1 ene 2004 año
18.13
-0.058
-0.32%
1 ene 2005 año
18.078
-0.052
-0.29%
1 ene 2006 año
18.031
-0.046
-0.26%
1 ene 2007 año
17.99
-0.041
-0.23%
1 ene 2008 año
17.951
-0.04
-0.22%
1 ene 2009 año
17.909
-0.042
-0.23%
1 ene 2010 año
17.882
-0.027
-0.15%
1 ene 2011 año
17.867
-0.014
-0.08%
1 ene 2012 año
17.854
-0.014
-0.08%
1 ene 2013 año
17.854
+0.0
0.0%
1 ene 2014 año
17.808
-0.046
-0.26%
1 ene 2015 año
17.799
-0.009
-0.05%
1 ene 2016 año
17.752
-0.048
-0.27%
Ranking de los países por los datos estadísticos actuales


Comentarios: