29
/es/
es
AIzaSyAYiBZKx7MnpbEhh9jyipgxe19OcubqV5w
April 1, 2024
160901
Israel
ISR
true
2
1
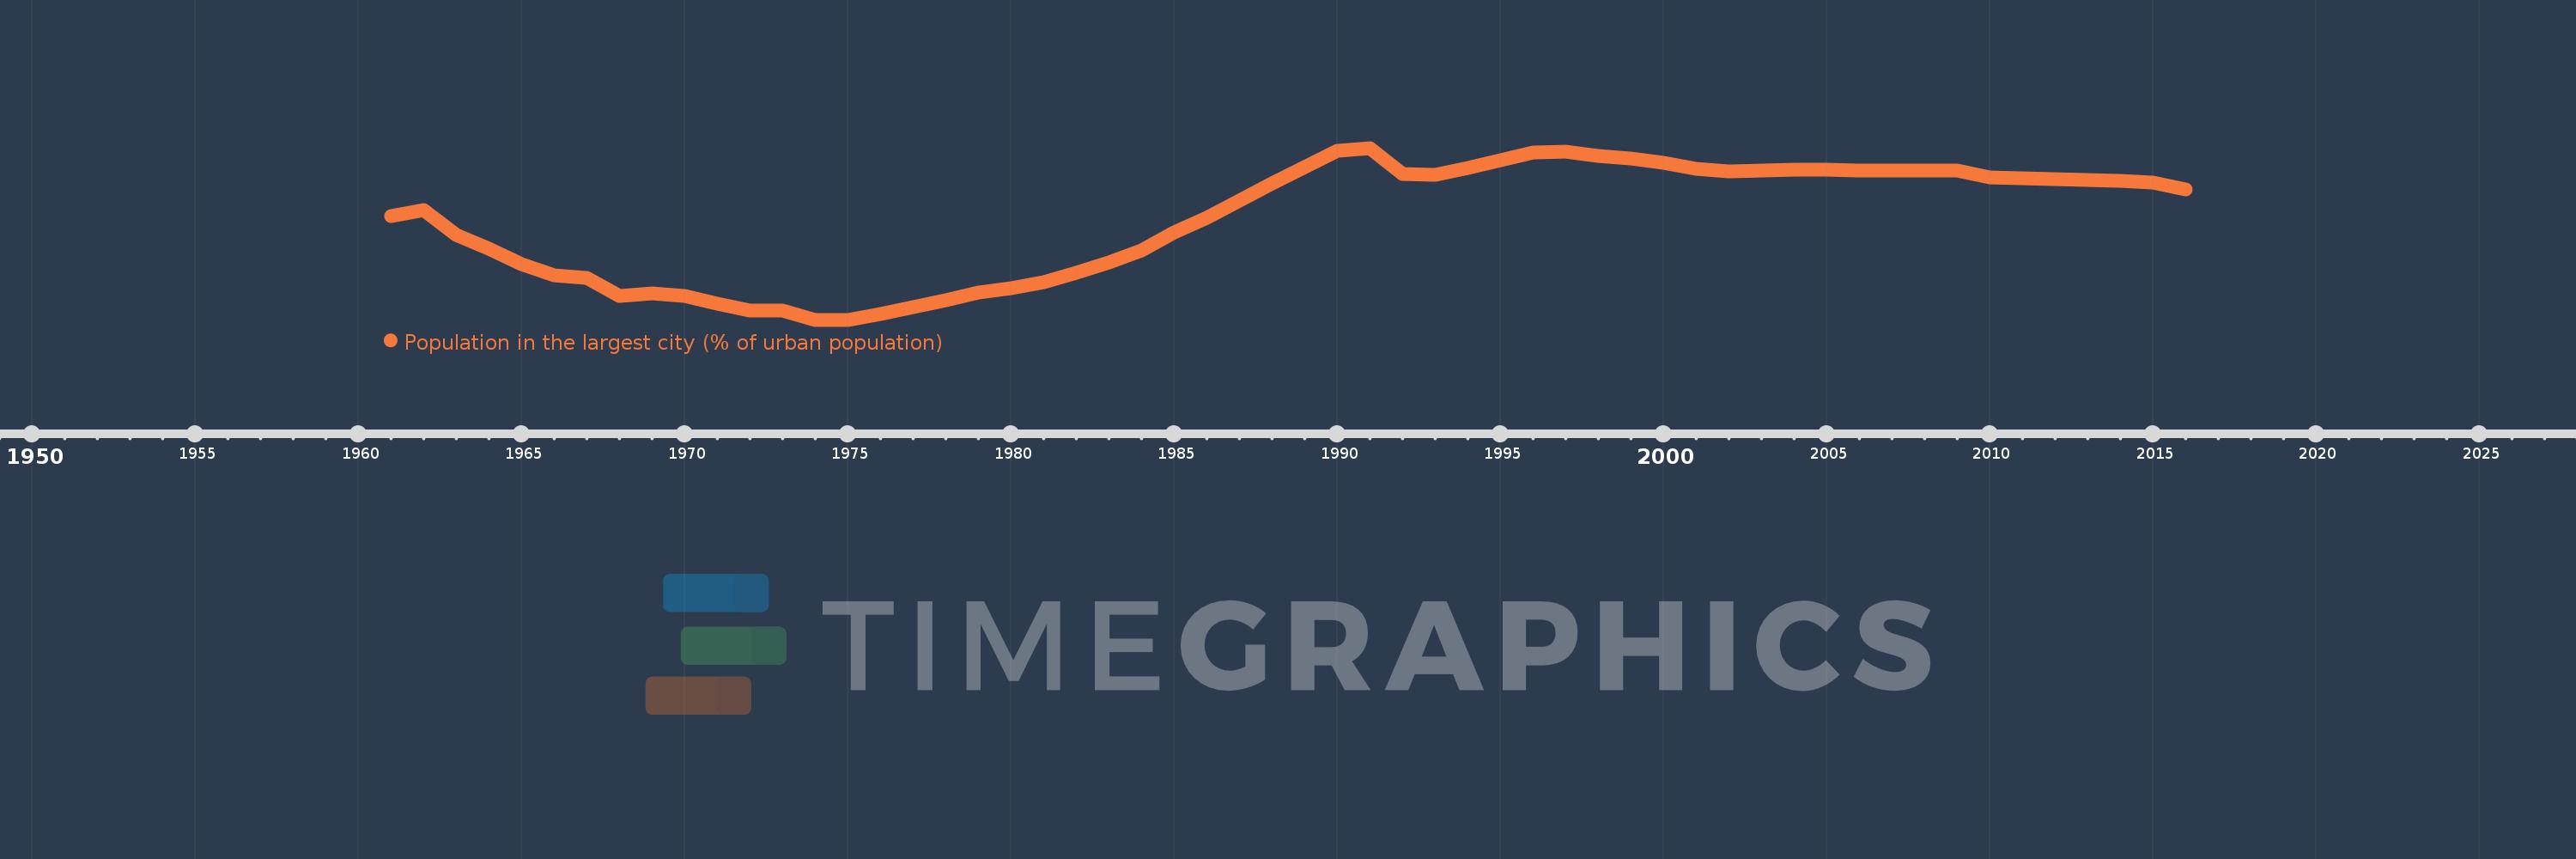
Population in the largest city (% of urban population)
2016,2015,2014,2013,2012,2011,2010,2009,2008,2007,2006,2005,2004,2003,2002,2001,2000,1999,1998,1997,1996,1995,1994,1993,1992,1991,1990,1989,1988,1987,1986,1985,1984,1983,1982,1981,1980,1979,1978,1977,1976,1975,1974,1973,1972,1971,1970,1969,1968,1967,1966,1965,1964,1963,1962,1961
Estas estadísticas en otros países:
AfghanistanAlbaniaAlgeriaAngolaArab WorldArgentinaArmeniaAustraliaAustriaAzerbaijanBahrainBangladeshBelarusBelgiumBeninBoliviaBosnia and HerzegovinaBrazilBulgariaBurkina FasoBurundiCambodiaCameroonCanadaCentral African RepublicCentral Europe and the BalticsChadChileChinaColombiaCongo, Dem. Rep.Congo, Rep.Costa RicaCote d'IvoireCroatiaCubaCzech RepublicDenmarkDjiboutiDominican RepublicEarly-demographic dividendEast Asia & PacificEast Asia & Pacific (excluding high income)East Asia & Pacific (IDA & IBRD countries)EcuadorEgypt, Arab Rep.El SalvadorEritreaEstoniaEthiopiaEuro areaEurope & Central AsiaEurope & Central Asia (excluding high income)Europe & Central Asia (IDA & IBRD countries)European UnionFinlandFragile and conflict affected situationsFranceGabonGambia, TheGeorgiaGermanyGhanaGreeceGuatemalaGuineaGuinea-BissauHaitiHeavily indebted poor countries (HIPC)High incomeHondurasHong Kong SAR, ChinaHungaryIBRD onlyIDA & IBRD totalIDA blendIDA onlyIDA totalIndiaIndonesiaIran, Islamic Rep.IraqIrelandIsraelItalyJamaicaJapanJordanKazakhstanKenyaKorea, Dem. People’s Rep.Korea, Rep.KuwaitKyrgyz RepublicLao PDRLate-demographic dividendLatin America & Caribbean Latin America & Caribbean (excluding high income)Latin America & the Caribbean (IDA & IBRD countries)LatviaLeast developed countries: UN classificationLebanonLiberiaLibyaLithuaniaLow & middle incomeLow incomeLower middle incomeMacao SAR, ChinaMacedonia, FYRMadagascarMalawiMalaysiaMaliMauritaniaMexicoMiddle East & North AfricaMiddle East & North Africa (excluding high income)Middle East & North Africa (IDA & IBRD countries)Middle incomeMoldovaMongoliaMoroccoMozambiqueMyanmarNamibiaNepalNetherlandsNew ZealandNicaraguaNigerNigeriaNorth AmericaNorwayOECD membersOmanPakistanPanamaPapua New GuineaParaguayPeruPhilippinesPolandPortugalPost-demographic dividendPre-demographic dividendPuerto RicoQatarRomaniaRussian FederationRwandaSaudi ArabiaSenegalSerbiaSierra LeoneSingaporeSlovak RepublicSomaliaSouth AfricaSouth AsiaSouth Asia (IDA & IBRD)South SudanSpainSri LankaSub-Saharan Africa Sub-Saharan Africa (excluding high income)Sub-Saharan Africa (IDA & IBRD countries)SudanSwedenSwitzerlandSyrian Arab RepublicTajikistanTanzaniaThailandTogoTunisiaTurkeyTurkmenistanUgandaUkraineUnited Arab EmiratesUnited KingdomUnited StatesUpper middle incomeUruguayUzbekistanVenezuela, RBVietnamWest Bank and GazaWorldYemen, Rep.ZambiaZimbabwe línea de tiempo (timeline):
En esta escala de tiempo se presenta un gráfico de 1961 y 2016 de Israel. Los datos de 1960 están ausentes. El número de observaciones reales por fecha: 56.
Fuente (nombre):
Indicadores del desarrollo mundial
Fuente (organización):
United Nations, World Urbanization Prospects.
Categorías:
Urban Development
Se ha actualizado:
23 abr 2017 año
Los indicadores de los cambios de valor en los últimos años
Mínimo:
40.333
1 ene 1974 año
Máximo:
48.765
1 ene 1991 año
A la fecha de observación
Valor
Cambio absoluto
El cambio con respecto al valor anterior
1 ene 1961 año
45.437
+45.437
0.0%
1 ene 1962 año
45.719
+0.282
0.62%
1 ene 1963 año
44.496
-1.223
-2.68%
1 ene 1964 año
43.819
-0.677
-1.52%
1 ene 1965 año
43.049
-0.77
-1.76%
1 ene 1966 año
42.5
-0.549
-1.27%
1 ene 1967 año
42.374
-0.126
-0.3%
1 ene 1968 año
41.518
-0.856
-2.02%
1 ene 1969 año
41.609
+0.091
0.22%
1 ene 1970 año
41.495
-0.113
-0.27%
1 ene 1971 año
41.102
-0.393
-0.95%
1 ene 1972 año
40.793
-0.309
-0.75%
1 ene 1973 año
40.77
-0.024
-0.06%
1 ene 1974 año
40.333
-0.437
-1.07%
1 ene 1975 año
40.339
+0.006
0.01%
1 ene 1976 año
40.631
+0.293
0.73%
1 ene 1977 año
40.954
+0.323
0.79%
1 ene 1978 año
41.28
+0.326
0.8%
1 ene 1979 año
41.67
+0.39
0.94%
1 ene 1980 año
41.876
+0.207
0.5%
1 ene 1981 año
42.161
+0.285
0.68%
1 ene 1982 año
42.625
+0.463
1.1%
1 ene 1983 año
43.149
+0.525
1.23%
1 ene 1984 año
43.72
+0.57
1.32%
1 ene 1985 año
44.632
+0.912
2.09%
1 ene 1986 año
45.352
+0.72
1.61%
1 ene 1987 año
46.187
+0.835
1.84%
1 ene 1988 año
47.005
+0.818
1.77%
1 ene 1989 año
47.821
+0.816
1.74%
1 ene 1990 año
48.628
+0.807
1.69%
1 ene 1991 año
48.765
+0.137
0.28%
1 ene 1992 año
47.494
-1.271
-2.61%
1 ene 1993 año
47.46
-0.034
-0.07%
1 ene 1994 año
47.801
+0.341
0.72%
1 ene 1995 año
48.181
+0.379
0.79%
1 ene 1996 año
48.526
+0.345
0.72%
1 ene 1997 año
48.583
+0.057
0.12%
1 ene 1998 año
48.372
-0.211
-0.44%
1 ene 1999 año
48.265
-0.107
-0.22%
1 ene 2000 año
48.034
-0.231
-0.48%
1 ene 2001 año
47.76
-0.274
-0.57%
1 ene 2002 año
47.62
-0.14
-0.29%
1 ene 2003 año
47.646
+0.026
0.05%
1 ene 2004 año
47.694
+0.048
0.1%
1 ene 2005 año
47.684
-0.01
-0.02%
1 ene 2006 año
47.675
-0.01
-0.02%
1 ene 2007 año
47.664
-0.011
-0.02%
1 ene 2008 año
47.65
-0.014
-0.03%
1 ene 2009 año
47.636
-0.013
-0.03%
1 ene 2010 año
47.329
-0.307
-0.64%
1 ene 2011 año
47.291
-0.038
-0.08%
1 ene 2012 año
47.243
-0.049
-0.1%
1 ene 2013 año
47.196
-0.047
-0.1%
1 ene 2014 año
47.137
-0.059
-0.12%
1 ene 2015 año
47.053
-0.084
-0.18%
1 ene 2016 año
46.729
-0.324
-0.69%
Ranking de los países por los datos estadísticos actuales


Comentarios: