29
/es/
es
AIzaSyAYiBZKx7MnpbEhh9jyipgxe19OcubqV5w
April 1, 2024
38497
IDA blend
IDB
false
2
1
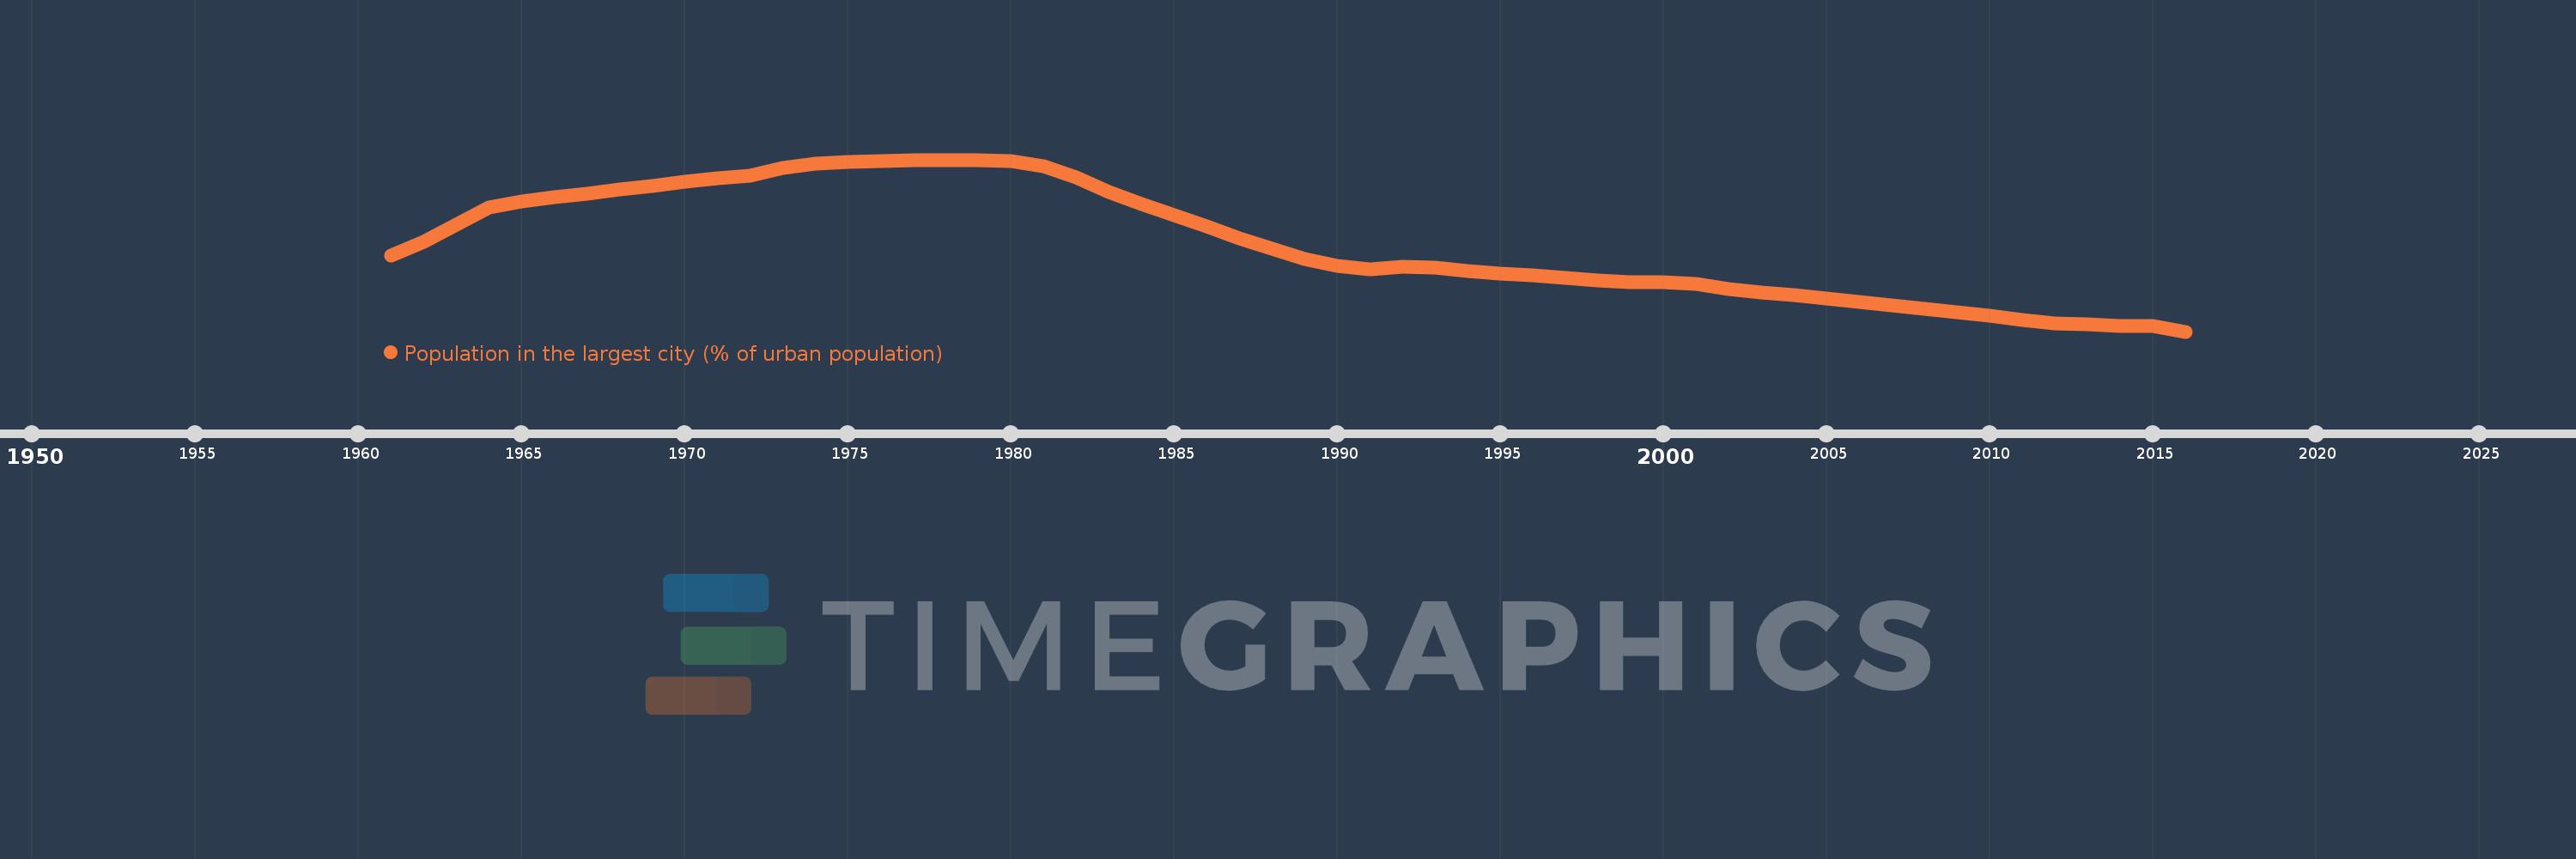
Population in the largest city (% of urban population)
2016,2015,2014,2013,2012,2011,2010,2009,2008,2007,2006,2005,2004,2003,2002,2001,2000,1999,1998,1997,1996,1995,1994,1993,1992,1991,1990,1989,1988,1987,1986,1985,1984,1983,1982,1981,1980,1979,1978,1977,1976,1975,1974,1973,1972,1971,1970,1969,1968,1967,1966,1965,1964,1963,1962,1961
Estas estadísticas en otros países:
AfghanistanAlbaniaAlgeriaAngolaArab WorldArgentinaArmeniaAustraliaAustriaAzerbaijanBahrainBangladeshBelarusBelgiumBeninBoliviaBosnia and HerzegovinaBrazilBulgariaBurkina FasoBurundiCambodiaCameroonCanadaCentral African RepublicCentral Europe and the BalticsChadChileChinaColombiaCongo, Dem. Rep.Congo, Rep.Costa RicaCote d'IvoireCroatiaCubaCzech RepublicDenmarkDjiboutiDominican RepublicEarly-demographic dividendEast Asia & PacificEast Asia & Pacific (excluding high income)East Asia & Pacific (IDA & IBRD countries)EcuadorEgypt, Arab Rep.El SalvadorEritreaEstoniaEthiopiaEuro areaEurope & Central AsiaEurope & Central Asia (excluding high income)Europe & Central Asia (IDA & IBRD countries)European UnionFinlandFragile and conflict affected situationsFranceGabonGambia, TheGeorgiaGermanyGhanaGreeceGuatemalaGuineaGuinea-BissauHaitiHeavily indebted poor countries (HIPC)High incomeHondurasHong Kong SAR, ChinaHungaryIBRD onlyIDA & IBRD totalIDA blendIDA onlyIDA totalIndiaIndonesiaIran, Islamic Rep.IraqIrelandIsraelItalyJamaicaJapanJordanKazakhstanKenyaKorea, Dem. People’s Rep.Korea, Rep.KuwaitKyrgyz RepublicLao PDRLate-demographic dividendLatin America & Caribbean Latin America & Caribbean (excluding high income)Latin America & the Caribbean (IDA & IBRD countries)LatviaLeast developed countries: UN classificationLebanonLiberiaLibyaLithuaniaLow & middle incomeLow incomeLower middle incomeMacao SAR, ChinaMacedonia, FYRMadagascarMalawiMalaysiaMaliMauritaniaMexicoMiddle East & North AfricaMiddle East & North Africa (excluding high income)Middle East & North Africa (IDA & IBRD countries)Middle incomeMoldovaMongoliaMoroccoMozambiqueMyanmarNamibiaNepalNetherlandsNew ZealandNicaraguaNigerNigeriaNorth AmericaNorwayOECD membersOmanPakistanPanamaPapua New GuineaParaguayPeruPhilippinesPolandPortugalPost-demographic dividendPre-demographic dividendPuerto RicoQatarRomaniaRussian FederationRwandaSaudi ArabiaSenegalSerbiaSierra LeoneSingaporeSlovak RepublicSomaliaSouth AfricaSouth AsiaSouth Asia (IDA & IBRD)South SudanSpainSri LankaSub-Saharan Africa Sub-Saharan Africa (excluding high income)Sub-Saharan Africa (IDA & IBRD countries)SudanSwedenSwitzerlandSyrian Arab RepublicTajikistanTanzaniaThailandTogoTunisiaTurkeyTurkmenistanUgandaUkraineUnited Arab EmiratesUnited KingdomUnited StatesUpper middle incomeUruguayUzbekistanVenezuela, RBVietnamWest Bank and GazaWorldYemen, Rep.ZambiaZimbabwe línea de tiempo (timeline):
En esta escala de tiempo se presenta un gráfico de 1961 y 2016 de IDA blend. Los datos de 1960 están ausentes. El número de observaciones reales por fecha: 56.
Fuente (nombre):
Indicadores del desarrollo mundial
Fuente (organización):
United Nations, World Urbanization Prospects.
Categorías:
Urban Development
Se ha actualizado:
23 abr 2017 año
Los indicadores de los cambios de valor en los últimos años
Mínimo:
21.328
1 ene 2016 año
Máximo:
23.898
1 ene 1978 año
A la fecha de observación
Valor
Cambio absoluto
El cambio con respecto al valor anterior
1 ene 1961 año
22.468
+22.468
0.0%
1 ene 1962 año
22.673
+0.205
0.91%
1 ene 1963 año
22.927
+0.254
1.12%
1 ene 1964 año
23.182
+0.255
1.11%
1 ene 1965 año
23.281
+0.099
0.43%
1 ene 1966 año
23.338
+0.057
0.25%
1 ene 1967 año
23.395
+0.056
0.24%
1 ene 1968 año
23.454
+0.059
0.25%
1 ene 1969 año
23.511
+0.057
0.24%
1 ene 1970 año
23.569
+0.058
0.25%
1 ene 1971 año
23.618
+0.049
0.21%
1 ene 1972 año
23.656
+0.038
0.16%
1 ene 1973 año
23.774
+0.118
0.5%
1 ene 1974 año
23.839
+0.065
0.27%
1 ene 1975 año
23.864
+0.025
0.11%
1 ene 1976 año
23.882
+0.018
0.08%
1 ene 1977 año
23.897
+0.014
0.06%
1 ene 1978 año
23.898
+0.001
0.0%
1 ene 1979 año
23.894
-0.004
-0.02%
1 ene 1980 año
23.884
-0.01
-0.04%
1 ene 1981 año
23.797
-0.086
-0.36%
1 ene 1982 año
23.629
-0.169
-0.71%
1 ene 1983 año
23.418
-0.211
-0.89%
1 ene 1984 año
23.241
-0.177
-0.76%
1 ene 1985 año
23.075
-0.165
-0.71%
1 ene 1986 año
22.905
-0.171
-0.74%
1 ene 1987 año
22.728
-0.176
-0.77%
1 ene 1988 año
22.562
-0.166
-0.73%
1 ene 1989 año
22.418
-0.144
-0.64%
1 ene 1990 año
22.305
-0.113
-0.5%
1 ene 1991 año
22.261
-0.044
-0.2%
1 ene 1992 año
22.303
+0.043
0.19%
1 ene 1993 año
22.291
-0.012
-0.05%
1 ene 1994 año
22.236
-0.055
-0.25%
1 ene 1995 año
22.195
-0.042
-0.19%
1 ene 1996 año
22.168
-0.027
-0.12%
1 ene 1997 año
22.125
-0.042
-0.19%
1 ene 1998 año
22.094
-0.031
-0.14%
1 ene 1999 año
22.073
-0.021
-0.1%
1 ene 2000 año
22.061
-0.012
-0.05%
1 ene 2001 año
22.037
-0.025
-0.11%
1 ene 2002 año
21.97
-0.067
-0.3%
1 ene 2003 año
21.918
-0.052
-0.24%
1 ene 2004 año
21.868
-0.05
-0.23%
1 ene 2005 año
21.817
-0.051
-0.23%
1 ene 2006 año
21.77
-0.046
-0.21%
1 ene 2007 año
21.725
-0.045
-0.21%
1 ene 2008 año
21.674
-0.05
-0.23%
1 ene 2009 año
21.62
-0.054
-0.25%
1 ene 2010 año
21.563
-0.057
-0.26%
1 ene 2011 año
21.499
-0.065
-0.3%
1 ene 2012 año
21.456
-0.043
-0.2%
1 ene 2013 año
21.434
-0.021
-0.1%
1 ene 2014 año
21.416
-0.018
-0.09%
1 ene 2015 año
21.41
-0.006
-0.03%
1 ene 2016 año
21.328
-0.082
-0.38%
Ranking de los países por los datos estadísticos actuales


Comentarios: