29
/es/
es
AIzaSyAYiBZKx7MnpbEhh9jyipgxe19OcubqV5w
April 1, 2024
50373
Middle East & North Africa (IDA & IBRD countries)
TMN
false
2
1
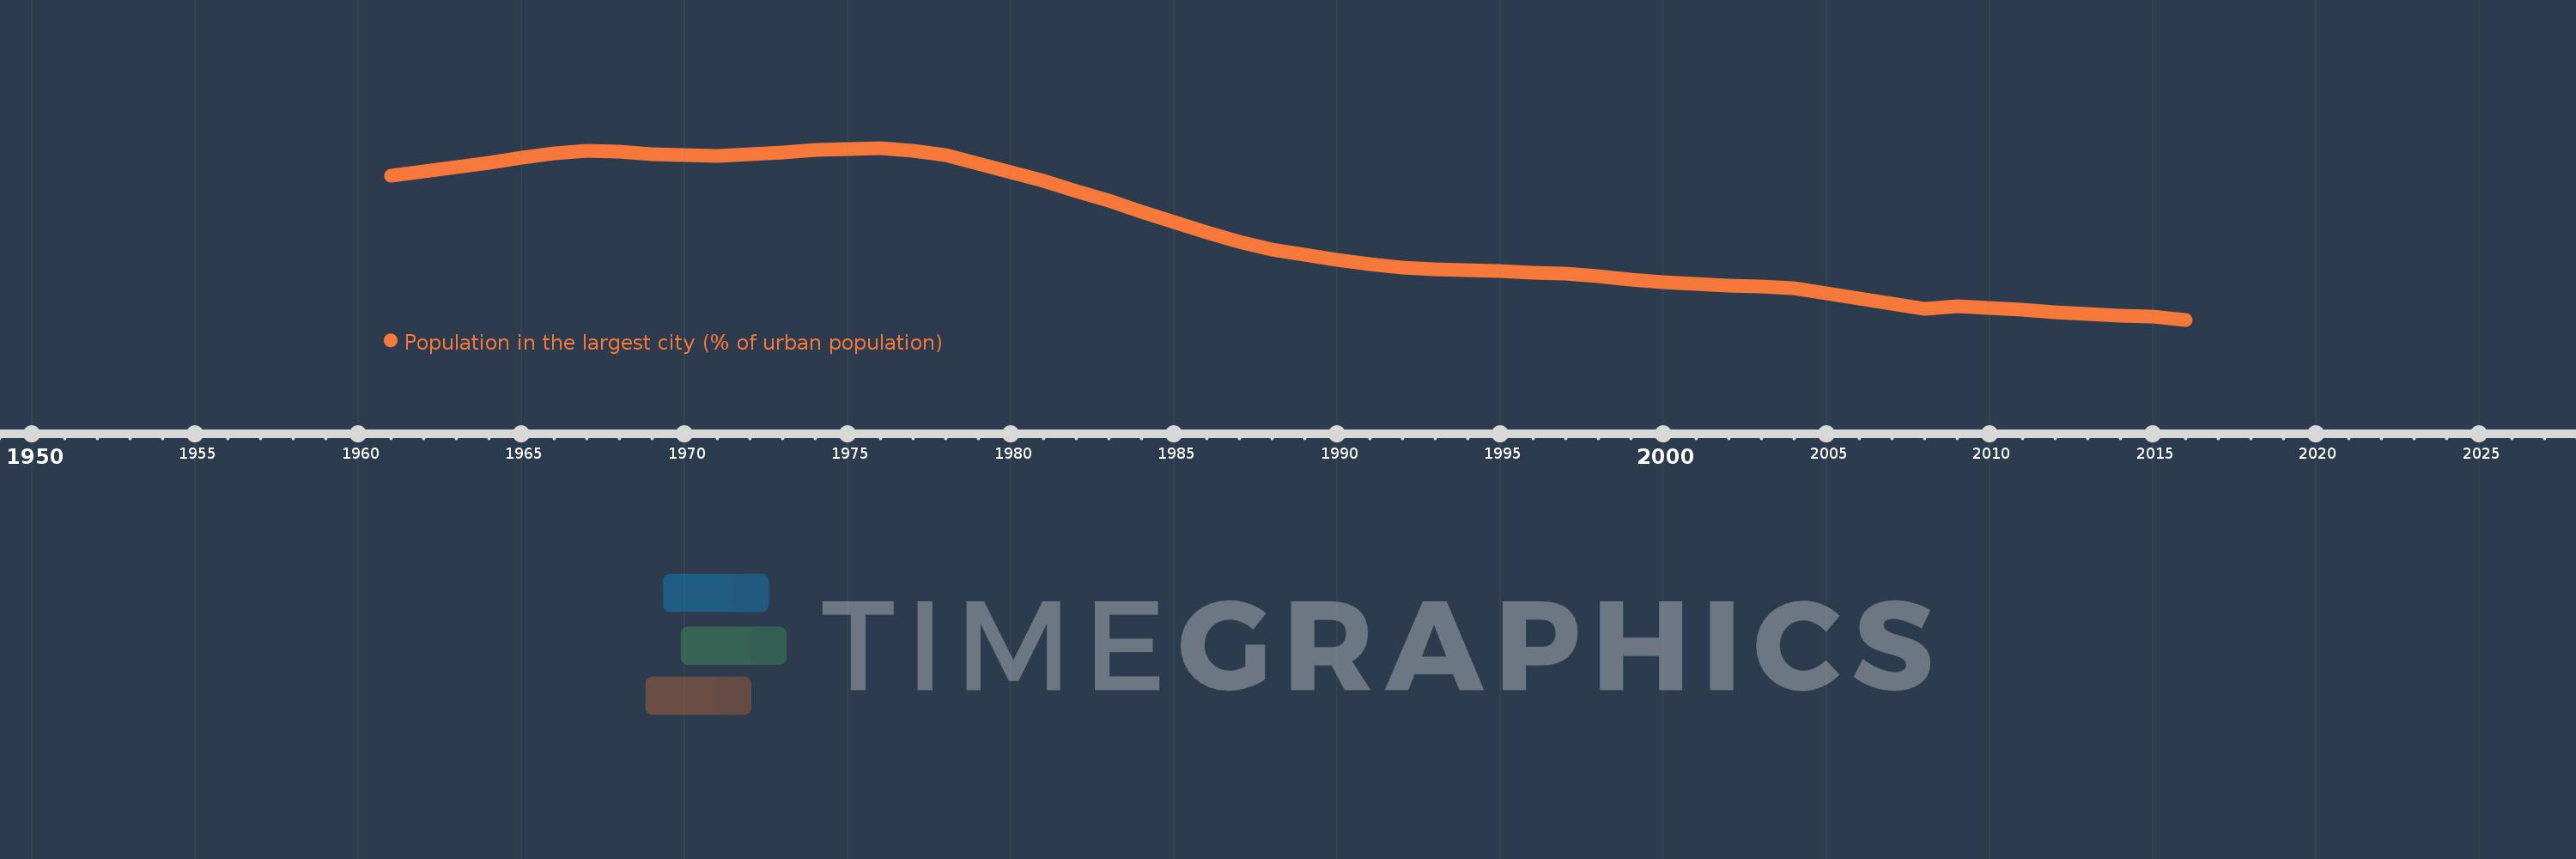
Population in the largest city (% of urban population)
2016,2015,2014,2013,2012,2011,2010,2009,2008,2007,2006,2005,2004,2003,2002,2001,2000,1999,1998,1997,1996,1995,1994,1993,1992,1991,1990,1989,1988,1987,1986,1985,1984,1983,1982,1981,1980,1979,1978,1977,1976,1975,1974,1973,1972,1971,1970,1969,1968,1967,1966,1965,1964,1963,1962,1961
Estas estadísticas en otros países:
AfghanistanAlbaniaAlgeriaAngolaArab WorldArgentinaArmeniaAustraliaAustriaAzerbaijanBahrainBangladeshBelarusBelgiumBeninBoliviaBosnia and HerzegovinaBrazilBulgariaBurkina FasoBurundiCambodiaCameroonCanadaCentral African RepublicCentral Europe and the BalticsChadChileChinaColombiaCongo, Dem. Rep.Congo, Rep.Costa RicaCote d'IvoireCroatiaCubaCzech RepublicDenmarkDjiboutiDominican RepublicEarly-demographic dividendEast Asia & PacificEast Asia & Pacific (excluding high income)East Asia & Pacific (IDA & IBRD countries)EcuadorEgypt, Arab Rep.El SalvadorEritreaEstoniaEthiopiaEuro areaEurope & Central AsiaEurope & Central Asia (excluding high income)Europe & Central Asia (IDA & IBRD countries)European UnionFinlandFragile and conflict affected situationsFranceGabonGambia, TheGeorgiaGermanyGhanaGreeceGuatemalaGuineaGuinea-BissauHaitiHeavily indebted poor countries (HIPC)High incomeHondurasHong Kong SAR, ChinaHungaryIBRD onlyIDA & IBRD totalIDA blendIDA onlyIDA totalIndiaIndonesiaIran, Islamic Rep.IraqIrelandIsraelItalyJamaicaJapanJordanKazakhstanKenyaKorea, Dem. People’s Rep.Korea, Rep.KuwaitKyrgyz RepublicLao PDRLate-demographic dividendLatin America & Caribbean Latin America & Caribbean (excluding high income)Latin America & the Caribbean (IDA & IBRD countries)LatviaLeast developed countries: UN classificationLebanonLiberiaLibyaLithuaniaLow & middle incomeLow incomeLower middle incomeMacao SAR, ChinaMacedonia, FYRMadagascarMalawiMalaysiaMaliMauritaniaMexicoMiddle East & North AfricaMiddle East & North Africa (excluding high income)Middle East & North Africa (IDA & IBRD countries)Middle incomeMoldovaMongoliaMoroccoMozambiqueMyanmarNamibiaNepalNetherlandsNew ZealandNicaraguaNigerNigeriaNorth AmericaNorwayOECD membersOmanPakistanPanamaPapua New GuineaParaguayPeruPhilippinesPolandPortugalPost-demographic dividendPre-demographic dividendPuerto RicoQatarRomaniaRussian FederationRwandaSaudi ArabiaSenegalSerbiaSierra LeoneSingaporeSlovak RepublicSomaliaSouth AfricaSouth AsiaSouth Asia (IDA & IBRD)South SudanSpainSri LankaSub-Saharan Africa Sub-Saharan Africa (excluding high income)Sub-Saharan Africa (IDA & IBRD countries)SudanSwedenSwitzerlandSyrian Arab RepublicTajikistanTanzaniaThailandTogoTunisiaTurkeyTurkmenistanUgandaUkraineUnited Arab EmiratesUnited KingdomUnited StatesUpper middle incomeUruguayUzbekistanVenezuela, RBVietnamWest Bank and GazaWorldYemen, Rep.ZambiaZimbabwe línea de tiempo (timeline):
En esta escala de tiempo se presenta un gráfico de 1961 y 2016 de Middle East & North Africa (IDA & IBRD countries). Los datos de 1960 están ausentes. El número de observaciones reales por fecha: 56.
Fuente (nombre):
Indicadores del desarrollo mundial
Fuente (organización):
United Nations, World Urbanization Prospects.
Categorías:
Urban Development
Se ha actualizado:
23 abr 2017 año
Los indicadores de los cambios de valor en los últimos años
Mínimo:
24.766
1 ene 2016 año
Máximo:
33.657
1 ene 1976 año
A la fecha de observación
Valor
Cambio absoluto
El cambio con respecto al valor anterior
1 ene 1961 año
32.231
+32.231
0.0%
1 ene 1962 año
32.431
+0.2
0.62%
1 ene 1963 año
32.659
+0.228
0.7%
1 ene 1964 año
32.893
+0.234
0.72%
1 ene 1965 año
33.138
+0.245
0.74%
1 ene 1966 año
33.375
+0.237
0.72%
1 ene 1967 año
33.523
+0.148
0.44%
1 ene 1968 año
33.444
-0.079
-0.24%
1 ene 1969 año
33.351
-0.093
-0.28%
1 ene 1970 año
33.281
-0.07
-0.21%
1 ene 1971 año
33.243
-0.038
-0.11%
1 ene 1972 año
33.318
+0.075
0.23%
1 ene 1973 año
33.418
+0.1
0.3%
1 ene 1974 año
33.533
+0.115
0.34%
1 ene 1975 año
33.596
+0.063
0.19%
1 ene 1976 año
33.657
+0.06
0.18%
1 ene 1977 año
33.524
-0.133
-0.39%
1 ene 1978 año
33.272
-0.252
-0.75%
1 ene 1979 año
32.857
-0.415
-1.25%
1 ene 1980 año
32.411
-0.446
-1.36%
1 ene 1981 año
31.934
-0.477
-1.47%
1 ene 1982 año
31.436
-0.498
-1.56%
1 ene 1983 año
30.933
-0.503
-1.6%
1 ene 1984 año
30.354
-0.579
-1.87%
1 ene 1985 año
29.808
-0.546
-1.8%
1 ene 1986 año
29.295
-0.513
-1.72%
1 ene 1987 año
28.813
-0.482
-1.64%
1 ene 1988 año
28.414
-0.399
-1.38%
1 ene 1989 año
28.133
-0.281
-0.99%
1 ene 1990 año
27.851
-0.282
-1.0%
1 ene 1991 año
27.625
-0.227
-0.81%
1 ene 1992 año
27.464
-0.161
-0.58%
1 ene 1993 año
27.377
-0.087
-0.32%
1 ene 1994 año
27.323
-0.054
-0.2%
1 ene 1995 año
27.274
-0.049
-0.18%
1 ene 1996 año
27.21
-0.064
-0.23%
1 ene 1997 año
27.143
-0.067
-0.25%
1 ene 1998 año
27.008
-0.135
-0.5%
1 ene 1999 año
26.86
-0.148
-0.55%
1 ene 2000 año
26.721
-0.139
-0.52%
1 ene 2001 año
26.607
-0.114
-0.43%
1 ene 2002 año
26.513
-0.094
-0.35%
1 ene 2003 año
26.469
-0.043
-0.16%
1 ene 2004 año
26.38
-0.089
-0.34%
1 ene 2005 año
26.122
-0.258
-0.98%
1 ene 2006 año
25.859
-0.263
-1.01%
1 ene 2007 año
25.603
-0.256
-0.99%
1 ene 2008 año
25.349
-0.254
-0.99%
1 ene 2009 año
25.478
+0.128
0.51%
1 ene 2010 año
25.37
-0.107
-0.42%
1 ene 2011 año
25.268
-0.102
-0.4%
1 ene 2012 año
25.169
-0.099
-0.39%
1 ene 2013 año
25.076
-0.093
-0.37%
1 ene 2014 año
24.988
-0.088
-0.35%
1 ene 2015 año
24.909
-0.08
-0.32%
1 ene 2016 año
24.766
-0.143
-0.57%
Ranking de los países por los datos estadísticos actuales


Comentarios: