29
/es/
es
AIzaSyAYiBZKx7MnpbEhh9jyipgxe19OcubqV5w
April 1, 2024
152966
Hungary
HUN
true
2
1
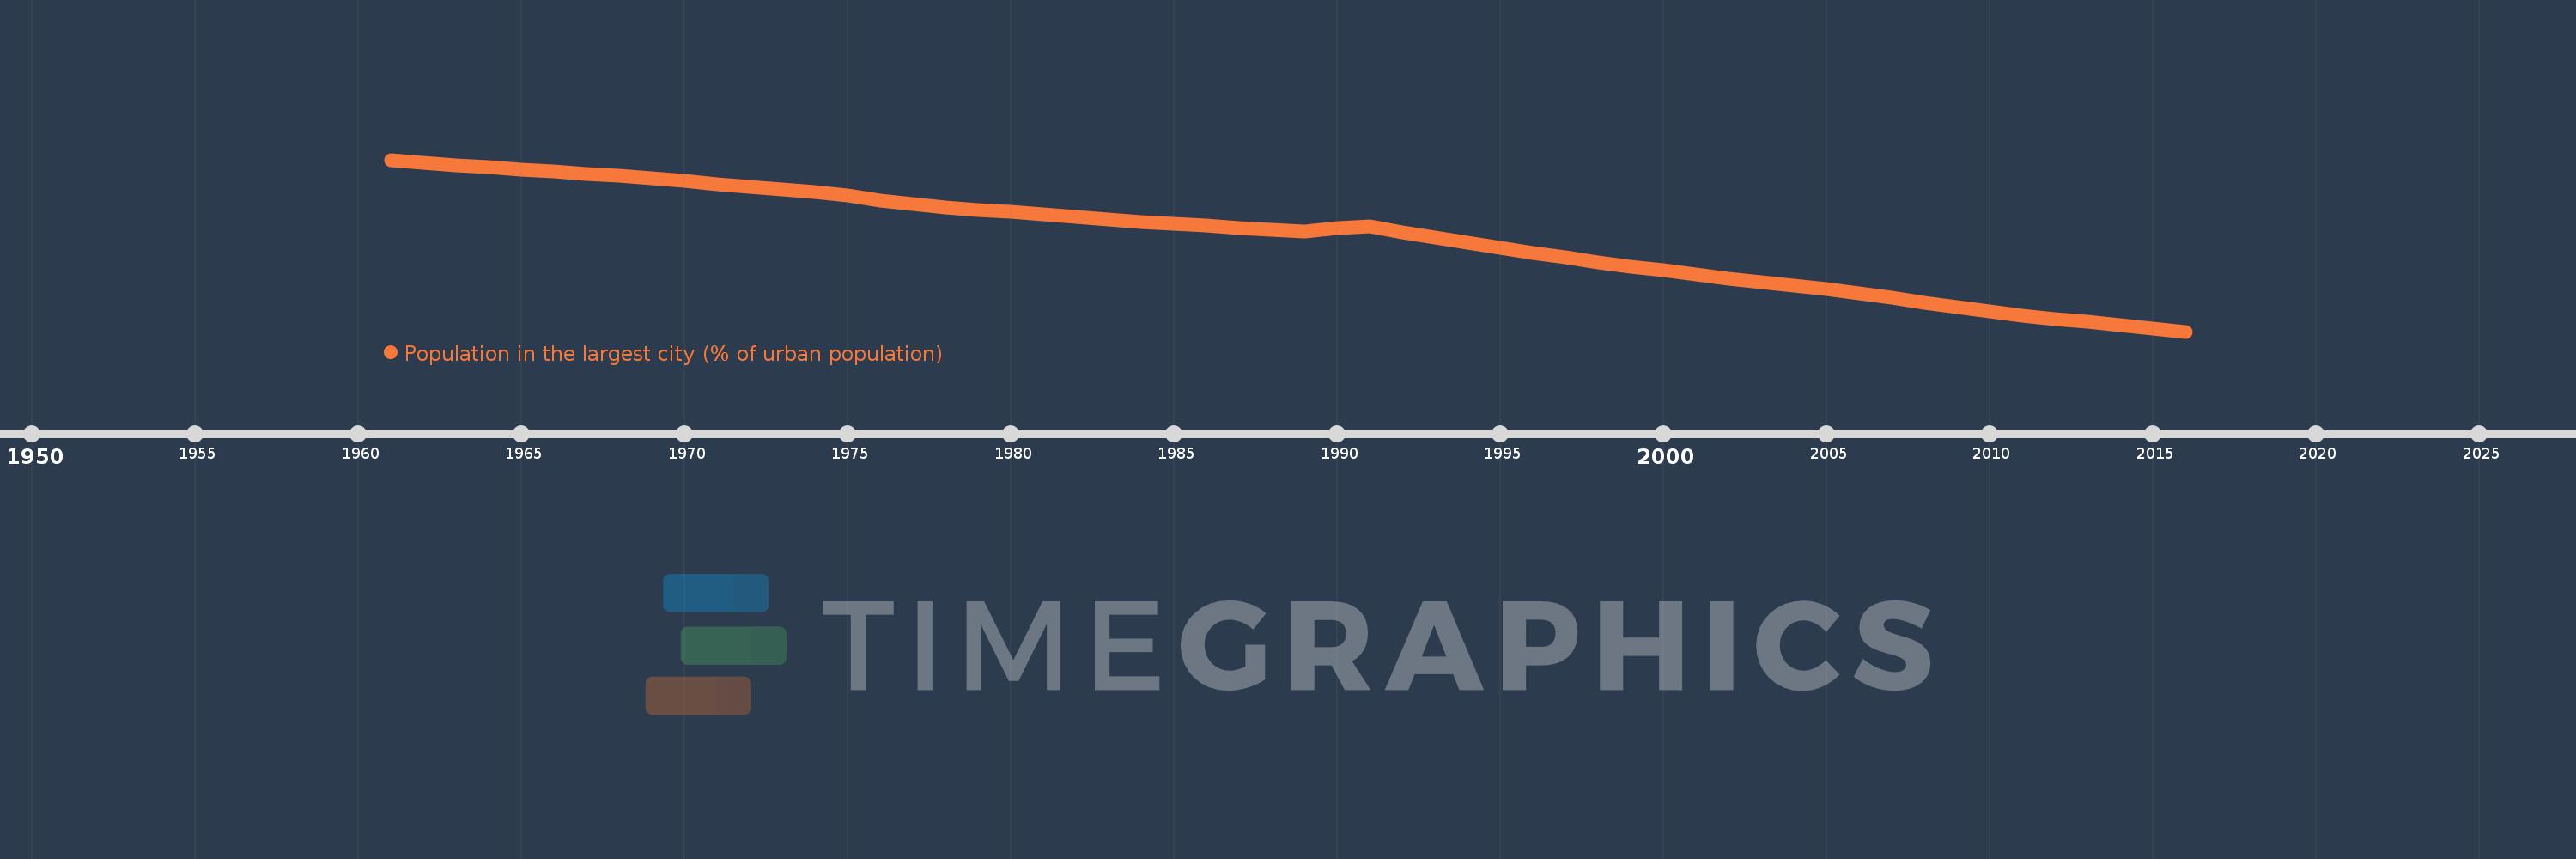
Population in the largest city (% of urban population)
2016,2015,2014,2013,2012,2011,2010,2009,2008,2007,2006,2005,2004,2003,2002,2001,2000,1999,1998,1997,1996,1995,1994,1993,1992,1991,1990,1989,1988,1987,1986,1985,1984,1983,1982,1981,1980,1979,1978,1977,1976,1975,1974,1973,1972,1971,1970,1969,1968,1967,1966,1965,1964,1963,1962,1961
Estas estadísticas en otros países:
AfghanistanAlbaniaAlgeriaAngolaArab WorldArgentinaArmeniaAustraliaAustriaAzerbaijanBahrainBangladeshBelarusBelgiumBeninBoliviaBosnia and HerzegovinaBrazilBulgariaBurkina FasoBurundiCambodiaCameroonCanadaCentral African RepublicCentral Europe and the BalticsChadChileChinaColombiaCongo, Dem. Rep.Congo, Rep.Costa RicaCote d'IvoireCroatiaCubaCzech RepublicDenmarkDjiboutiDominican RepublicEarly-demographic dividendEast Asia & PacificEast Asia & Pacific (excluding high income)East Asia & Pacific (IDA & IBRD countries)EcuadorEgypt, Arab Rep.El SalvadorEritreaEstoniaEthiopiaEuro areaEurope & Central AsiaEurope & Central Asia (excluding high income)Europe & Central Asia (IDA & IBRD countries)European UnionFinlandFragile and conflict affected situationsFranceGabonGambia, TheGeorgiaGermanyGhanaGreeceGuatemalaGuineaGuinea-BissauHaitiHeavily indebted poor countries (HIPC)High incomeHondurasHong Kong SAR, ChinaHungaryIBRD onlyIDA & IBRD totalIDA blendIDA onlyIDA totalIndiaIndonesiaIran, Islamic Rep.IraqIrelandIsraelItalyJamaicaJapanJordanKazakhstanKenyaKorea, Dem. People’s Rep.Korea, Rep.KuwaitKyrgyz RepublicLao PDRLate-demographic dividendLatin America & Caribbean Latin America & Caribbean (excluding high income)Latin America & the Caribbean (IDA & IBRD countries)LatviaLeast developed countries: UN classificationLebanonLiberiaLibyaLithuaniaLow & middle incomeLow incomeLower middle incomeMacao SAR, ChinaMacedonia, FYRMadagascarMalawiMalaysiaMaliMauritaniaMexicoMiddle East & North AfricaMiddle East & North Africa (excluding high income)Middle East & North Africa (IDA & IBRD countries)Middle incomeMoldovaMongoliaMoroccoMozambiqueMyanmarNamibiaNepalNetherlandsNew ZealandNicaraguaNigerNigeriaNorth AmericaNorwayOECD membersOmanPakistanPanamaPapua New GuineaParaguayPeruPhilippinesPolandPortugalPost-demographic dividendPre-demographic dividendPuerto RicoQatarRomaniaRussian FederationRwandaSaudi ArabiaSenegalSerbiaSierra LeoneSingaporeSlovak RepublicSomaliaSouth AfricaSouth AsiaSouth Asia (IDA & IBRD)South SudanSpainSri LankaSub-Saharan Africa Sub-Saharan Africa (excluding high income)Sub-Saharan Africa (IDA & IBRD countries)SudanSwedenSwitzerlandSyrian Arab RepublicTajikistanTanzaniaThailandTogoTunisiaTurkeyTurkmenistanUgandaUkraineUnited Arab EmiratesUnited KingdomUnited StatesUpper middle incomeUruguayUzbekistanVenezuela, RBVietnamWest Bank and GazaWorldYemen, Rep.ZambiaZimbabwe línea de tiempo (timeline):
En esta escala de tiempo se presenta un gráfico de 1961 y 2016 de Hungary. Los datos de 1960 están ausentes. El número de observaciones reales por fecha: 56.
Fuente (nombre):
Indicadores del desarrollo mundial
Fuente (organización):
United Nations, World Urbanization Prospects.
Categorías:
Urban Development
Se ha actualizado:
23 abr 2017 año
Los indicadores de los cambios de valor en los últimos años
Mínimo:
24.442
1 ene 2016 año
Máximo:
32.445
1 ene 1961 año
A la fecha de observación
Valor
Cambio absoluto
El cambio con respecto al valor anterior
1 ene 1961 año
32.445
+32.445
0.0%
1 ene 1962 año
32.288
-0.157
-0.48%
1 ene 1963 año
32.176
-0.112
-0.35%
1 ene 1964 año
32.087
-0.089
-0.28%
1 ene 1965 año
31.983
-0.104
-0.32%
1 ene 1966 año
31.894
-0.089
-0.28%
1 ene 1967 año
31.799
-0.095
-0.3%
1 ene 1968 año
31.685
-0.114
-0.36%
1 ene 1969 año
31.57
-0.115
-0.36%
1 ene 1970 año
31.446
-0.123
-0.39%
1 ene 1971 año
31.314
-0.132
-0.42%
1 ene 1972 año
31.19
-0.124
-0.4%
1 ene 1973 año
31.064
-0.125
-0.4%
1 ene 1974 año
30.935
-0.13
-0.42%
1 ene 1975 año
30.769
-0.165
-0.53%
1 ene 1976 año
30.564
-0.206
-0.67%
1 ene 1977 año
30.373
-0.19
-0.62%
1 ene 1978 año
30.212
-0.161
-0.53%
1 ene 1979 año
30.091
-0.122
-0.4%
1 ene 1980 año
30.021
-0.07
-0.23%
1 ene 1981 año
29.92
-0.1
-0.33%
1 ene 1982 año
29.772
-0.148
-0.5%
1 ene 1983 año
29.644
-0.128
-0.43%
1 ene 1984 año
29.544
-0.1
-0.34%
1 ene 1985 año
29.458
-0.085
-0.29%
1 ene 1986 año
29.369
-0.089
-0.3%
1 ene 1987 año
29.277
-0.092
-0.31%
1 ene 1988 año
29.185
-0.092
-0.31%
1 ene 1989 año
29.089
-0.096
-0.33%
1 ene 1990 año
29.267
+0.178
0.61%
1 ene 1991 año
29.359
+0.092
0.31%
1 ene 1992 año
29.08
-0.279
-0.95%
1 ene 1993 año
28.813
-0.267
-0.92%
1 ene 1994 año
28.571
-0.242
-0.84%
1 ene 1995 año
28.338
-0.234
-0.82%
1 ene 1996 año
28.107
-0.231
-0.81%
1 ene 1997 año
27.886
-0.22
-0.78%
1 ene 1998 año
27.677
-0.209
-0.75%
1 ene 1999 año
27.478
-0.199
-0.72%
1 ene 2000 año
27.295
-0.184
-0.67%
1 ene 2001 año
27.105
-0.189
-0.69%
1 ene 2002 año
26.917
-0.188
-0.69%
1 ene 2003 año
26.757
-0.16
-0.59%
1 ene 2004 año
26.601
-0.156
-0.58%
1 ene 2005 año
26.43
-0.171
-0.64%
1 ene 2006 año
26.235
-0.195
-0.74%
1 ene 2007 año
26.012
-0.223
-0.85%
1 ene 2008 año
25.793
-0.219
-0.84%
1 ene 2009 año
25.584
-0.209
-0.81%
1 ene 2010 año
25.375
-0.209
-0.82%
1 ene 2011 año
25.188
-0.187
-0.74%
1 ene 2012 año
25.019
-0.169
-0.67%
1 ene 2013 año
24.913
-0.106
-0.43%
1 ene 2014 año
24.752
-0.161
-0.65%
1 ene 2015 año
24.594
-0.157
-0.64%
1 ene 2016 año
24.442
-0.152
-0.62%
Ranking de los países por los datos estadísticos actuales


Comentarios: