29
/es/
es
AIzaSyAYiBZKx7MnpbEhh9jyipgxe19OcubqV5w
April 1, 2024
269852
Turkey
TUR
true
2
1
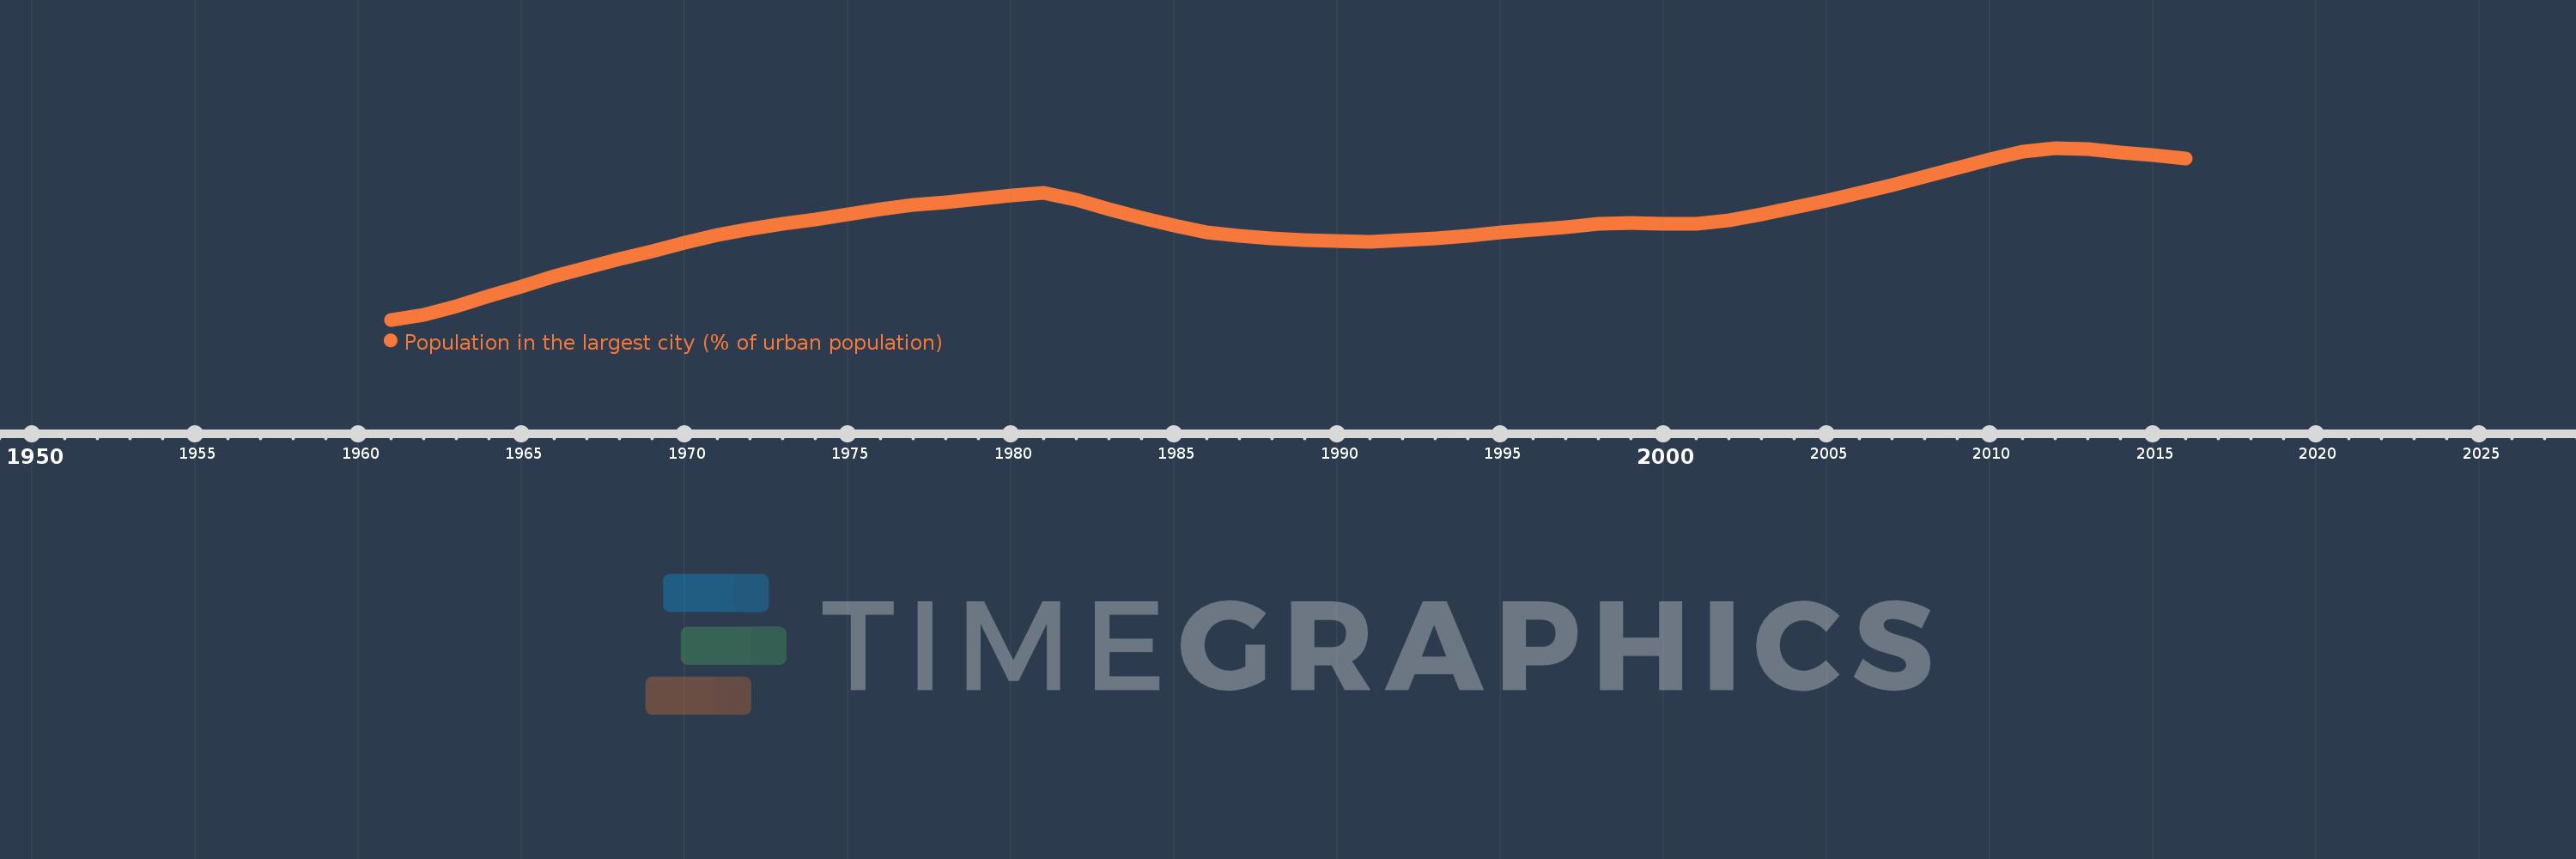
Population in the largest city (% of urban population)
2016,2015,2014,2013,2012,2011,2010,2009,2008,2007,2006,2005,2004,2003,2002,2001,2000,1999,1998,1997,1996,1995,1994,1993,1992,1991,1990,1989,1988,1987,1986,1985,1984,1983,1982,1981,1980,1979,1978,1977,1976,1975,1974,1973,1972,1971,1970,1969,1968,1967,1966,1965,1964,1963,1962,1961
Estas estadísticas en otros países:
AfghanistanAlbaniaAlgeriaAngolaArab WorldArgentinaArmeniaAustraliaAustriaAzerbaijanBahrainBangladeshBelarusBelgiumBeninBoliviaBosnia and HerzegovinaBrazilBulgariaBurkina FasoBurundiCambodiaCameroonCanadaCentral African RepublicCentral Europe and the BalticsChadChileChinaColombiaCongo, Dem. Rep.Congo, Rep.Costa RicaCote d'IvoireCroatiaCubaCzech RepublicDenmarkDjiboutiDominican RepublicEarly-demographic dividendEast Asia & PacificEast Asia & Pacific (excluding high income)East Asia & Pacific (IDA & IBRD countries)EcuadorEgypt, Arab Rep.El SalvadorEritreaEstoniaEthiopiaEuro areaEurope & Central AsiaEurope & Central Asia (excluding high income)Europe & Central Asia (IDA & IBRD countries)European UnionFinlandFragile and conflict affected situationsFranceGabonGambia, TheGeorgiaGermanyGhanaGreeceGuatemalaGuineaGuinea-BissauHaitiHeavily indebted poor countries (HIPC)High incomeHondurasHong Kong SAR, ChinaHungaryIBRD onlyIDA & IBRD totalIDA blendIDA onlyIDA totalIndiaIndonesiaIran, Islamic Rep.IraqIrelandIsraelItalyJamaicaJapanJordanKazakhstanKenyaKorea, Dem. People’s Rep.Korea, Rep.KuwaitKyrgyz RepublicLao PDRLate-demographic dividendLatin America & Caribbean Latin America & Caribbean (excluding high income)Latin America & the Caribbean (IDA & IBRD countries)LatviaLeast developed countries: UN classificationLebanonLiberiaLibyaLithuaniaLow & middle incomeLow incomeLower middle incomeMacao SAR, ChinaMacedonia, FYRMadagascarMalawiMalaysiaMaliMauritaniaMexicoMiddle East & North AfricaMiddle East & North Africa (excluding high income)Middle East & North Africa (IDA & IBRD countries)Middle incomeMoldovaMongoliaMoroccoMozambiqueMyanmarNamibiaNepalNetherlandsNew ZealandNicaraguaNigerNigeriaNorth AmericaNorwayOECD membersOmanPakistanPanamaPapua New GuineaParaguayPeruPhilippinesPolandPortugalPost-demographic dividendPre-demographic dividendPuerto RicoQatarRomaniaRussian FederationRwandaSaudi ArabiaSenegalSerbiaSierra LeoneSingaporeSlovak RepublicSomaliaSouth AfricaSouth AsiaSouth Asia (IDA & IBRD)South SudanSpainSri LankaSub-Saharan Africa Sub-Saharan Africa (excluding high income)Sub-Saharan Africa (IDA & IBRD countries)SudanSwedenSwitzerlandSyrian Arab RepublicTajikistanTanzaniaThailandTogoTunisiaTurkeyTurkmenistanUgandaUkraineUnited Arab EmiratesUnited KingdomUnited StatesUpper middle incomeUruguayUzbekistanVenezuela, RBVietnamWest Bank and GazaWorldYemen, Rep.ZambiaZimbabwe línea de tiempo (timeline):
En esta escala de tiempo se presenta un gráfico de 1961 y 2016 de Turkey. Los datos de 1960 están ausentes. El número de observaciones reales por fecha: 56.
Fuente (nombre):
Indicadores del desarrollo mundial
Fuente (organización):
United Nations, World Urbanization Prospects.
Categorías:
Urban Development
Se ha actualizado:
23 abr 2017 año
Los indicadores de los cambios de valor en los últimos años
Mínimo:
16.737
1 ene 1961 año
Máximo:
25.041
1 ene 2012 año
A la fecha de observación
Valor
Cambio absoluto
El cambio con respecto al valor anterior
1 ene 1961 año
16.737
+16.737
0.0%
1 ene 1962 año
16.958
+0.22
1.32%
1 ene 1963 año
17.404
+0.446
2.63%
1 ene 1964 año
17.87
+0.466
2.68%
1 ene 1965 año
18.357
+0.488
2.73%
1 ene 1966 año
18.861
+0.503
2.74%
1 ene 1967 año
19.274
+0.414
2.19%
1 ene 1968 año
19.653
+0.378
1.96%
1 ene 1969 año
20.045
+0.393
2.0%
1 ene 1970 año
20.444
+0.399
1.99%
1 ene 1971 año
20.851
+0.407
1.99%
1 ene 1972 año
21.136
+0.285
1.37%
1 ene 1973 año
21.364
+0.228
1.08%
1 ene 1974 año
21.595
+0.23
1.08%
1 ene 1975 año
21.837
+0.242
1.12%
1 ene 1976 año
22.094
+0.257
1.18%
1 ene 1977 año
22.273
+0.18
0.81%
1 ene 1978 año
22.419
+0.145
0.65%
1 ene 1979 año
22.572
+0.153
0.68%
1 ene 1980 año
22.725
+0.153
0.68%
1 ene 1981 año
22.875
+0.15
0.66%
1 ene 1982 año
22.555
-0.32
-1.4%
1 ene 1983 año
22.085
-0.47
-2.08%
1 ene 1984 año
21.659
-0.426
-1.93%
1 ene 1985 año
21.284
-0.375
-1.73%
1 ene 1986 año
20.964
-0.319
-1.5%
1 ene 1987 año
20.777
-0.187
-0.89%
1 ene 1988 año
20.662
-0.115
-0.55%
1 ene 1989 año
20.58
-0.082
-0.4%
1 ene 1990 año
20.526
-0.054
-0.26%
1 ene 1991 año
20.497
-0.029
-0.14%
1 ene 1992 año
20.567
+0.07
0.34%
1 ene 1993 año
20.684
+0.118
0.57%
1 ene 1994 año
20.811
+0.127
0.61%
1 ene 1995 año
20.946
+0.135
0.65%
1 ene 1996 año
21.084
+0.138
0.66%
1 ene 1997 año
21.227
+0.142
0.68%
1 ene 1998 año
21.372
+0.145
0.68%
1 ene 1999 año
21.411
+0.039
0.18%
1 ene 2000 año
21.379
-0.032
-0.15%
1 ene 2001 año
21.357
-0.022
-0.1%
1 ene 2002 año
21.55
+0.194
0.91%
1 ene 2003 año
21.85
+0.299
1.39%
1 ene 2004 año
22.164
+0.315
1.44%
1 ene 2005 año
22.5
+0.336
1.51%
1 ene 2006 año
22.856
+0.356
1.58%
1 ene 2007 año
23.241
+0.385
1.68%
1 ene 2008 año
23.65
+0.41
1.76%
1 ene 2009 año
24.07
+0.419
1.77%
1 ene 2010 año
24.471
+0.402
1.67%
1 ene 2011 año
24.843
+0.372
1.52%
1 ene 2012 año
25.041
+0.197
0.79%
1 ene 2013 año
24.977
-0.063
-0.25%
1 ene 2014 año
24.816
-0.161
-0.65%
1 ene 2015 año
24.693
-0.122
-0.49%
1 ene 2016 año
24.531
-0.162
-0.66%
Ranking de los países por los datos estadísticos actuales


Comentarios: