29
/es/
es
AIzaSyAYiBZKx7MnpbEhh9jyipgxe19OcubqV5w
April 1, 2024
35299
Heavily indebted poor countries (HIPC)
HPC
false
2
1
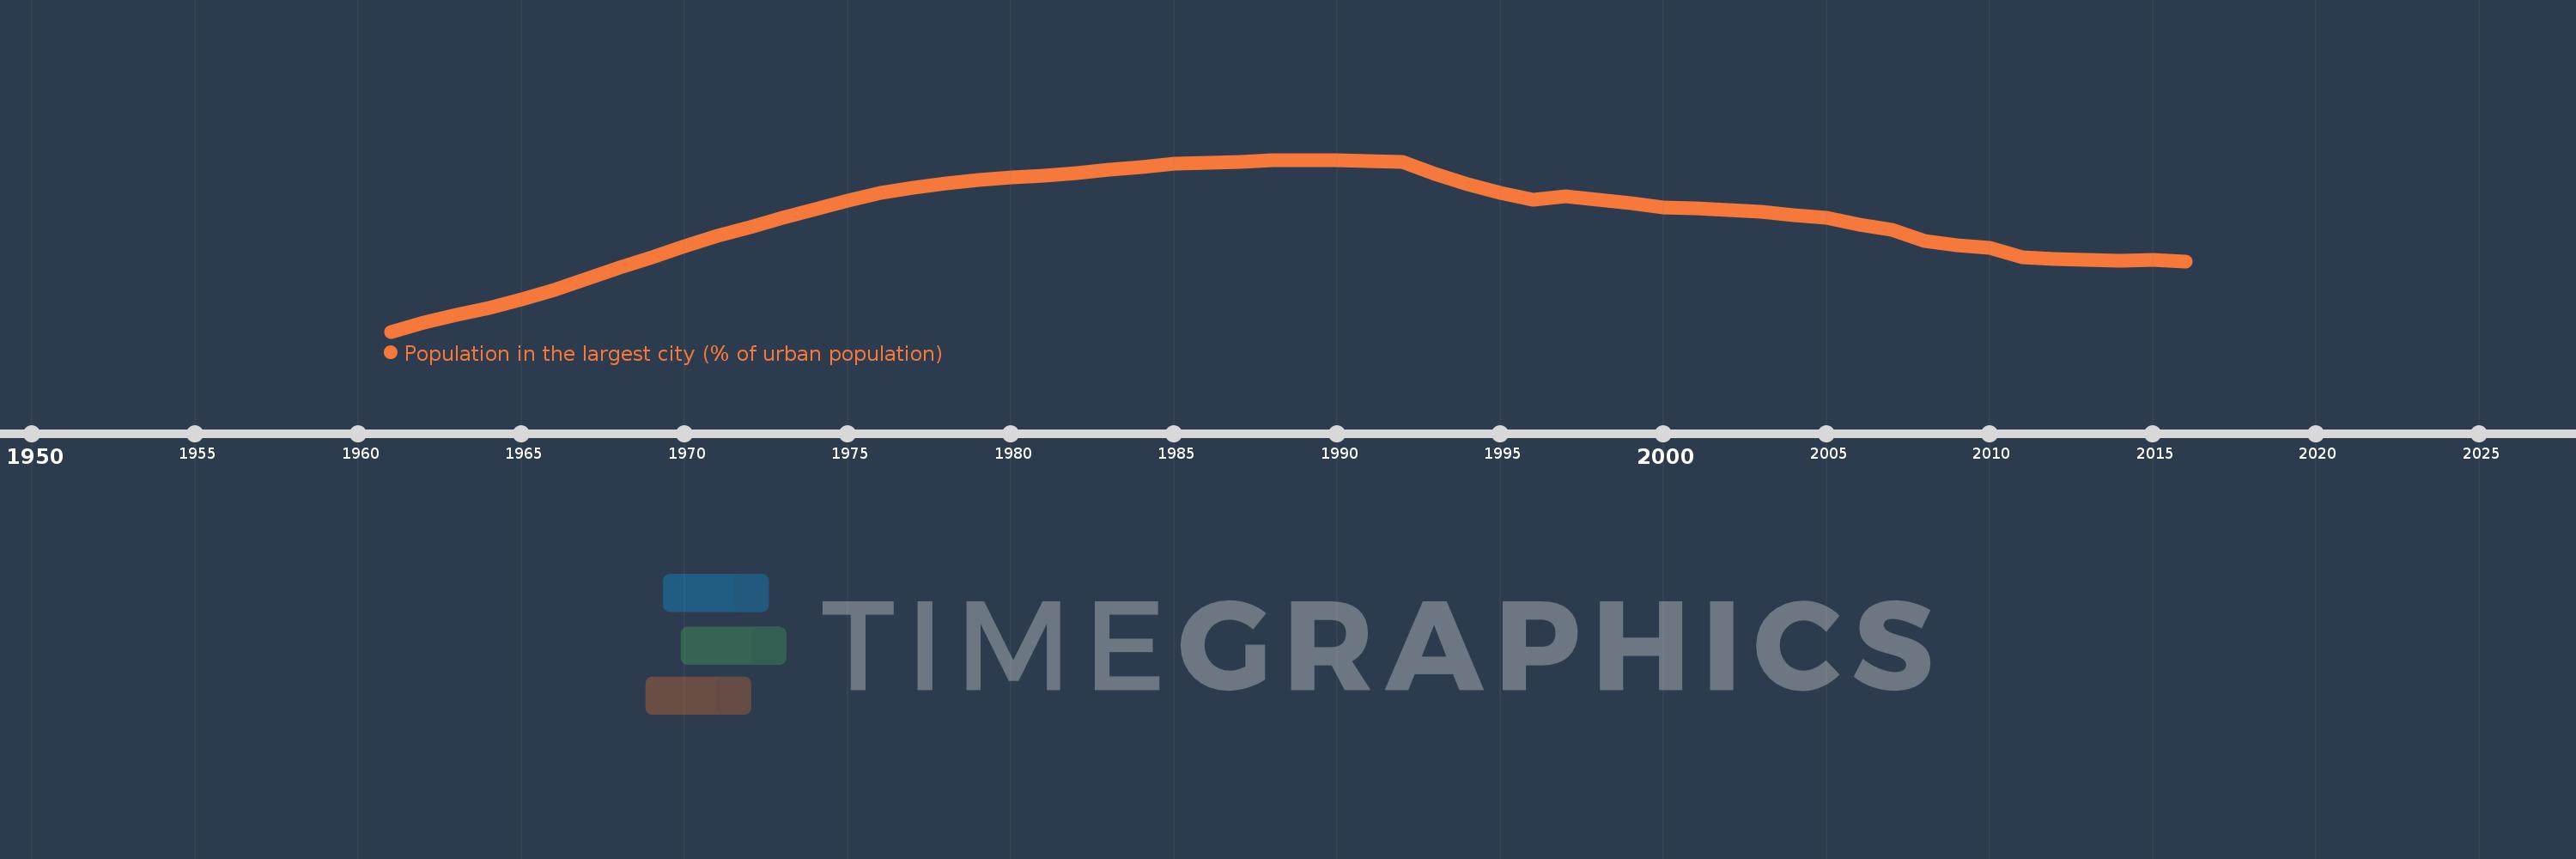
Population in the largest city (% of urban population)
2016,2015,2014,2013,2012,2011,2010,2009,2008,2007,2006,2005,2004,2003,2002,2001,2000,1999,1998,1997,1996,1995,1994,1993,1992,1991,1990,1989,1988,1987,1986,1985,1984,1983,1982,1981,1980,1979,1978,1977,1976,1975,1974,1973,1972,1971,1970,1969,1968,1967,1966,1965,1964,1963,1962,1961
Estas estadísticas en otros países:
AfghanistanAlbaniaAlgeriaAngolaArab WorldArgentinaArmeniaAustraliaAustriaAzerbaijanBahrainBangladeshBelarusBelgiumBeninBoliviaBosnia and HerzegovinaBrazilBulgariaBurkina FasoBurundiCambodiaCameroonCanadaCentral African RepublicCentral Europe and the BalticsChadChileChinaColombiaCongo, Dem. Rep.Congo, Rep.Costa RicaCote d'IvoireCroatiaCubaCzech RepublicDenmarkDjiboutiDominican RepublicEarly-demographic dividendEast Asia & PacificEast Asia & Pacific (excluding high income)East Asia & Pacific (IDA & IBRD countries)EcuadorEgypt, Arab Rep.El SalvadorEritreaEstoniaEthiopiaEuro areaEurope & Central AsiaEurope & Central Asia (excluding high income)Europe & Central Asia (IDA & IBRD countries)European UnionFinlandFragile and conflict affected situationsFranceGabonGambia, TheGeorgiaGermanyGhanaGreeceGuatemalaGuineaGuinea-BissauHaitiHeavily indebted poor countries (HIPC)High incomeHondurasHong Kong SAR, ChinaHungaryIBRD onlyIDA & IBRD totalIDA blendIDA onlyIDA totalIndiaIndonesiaIran, Islamic Rep.IraqIrelandIsraelItalyJamaicaJapanJordanKazakhstanKenyaKorea, Dem. People’s Rep.Korea, Rep.KuwaitKyrgyz RepublicLao PDRLate-demographic dividendLatin America & Caribbean Latin America & Caribbean (excluding high income)Latin America & the Caribbean (IDA & IBRD countries)LatviaLeast developed countries: UN classificationLebanonLiberiaLibyaLithuaniaLow & middle incomeLow incomeLower middle incomeMacao SAR, ChinaMacedonia, FYRMadagascarMalawiMalaysiaMaliMauritaniaMexicoMiddle East & North AfricaMiddle East & North Africa (excluding high income)Middle East & North Africa (IDA & IBRD countries)Middle incomeMoldovaMongoliaMoroccoMozambiqueMyanmarNamibiaNepalNetherlandsNew ZealandNicaraguaNigerNigeriaNorth AmericaNorwayOECD membersOmanPakistanPanamaPapua New GuineaParaguayPeruPhilippinesPolandPortugalPost-demographic dividendPre-demographic dividendPuerto RicoQatarRomaniaRussian FederationRwandaSaudi ArabiaSenegalSerbiaSierra LeoneSingaporeSlovak RepublicSomaliaSouth AfricaSouth AsiaSouth Asia (IDA & IBRD)South SudanSpainSri LankaSub-Saharan Africa Sub-Saharan Africa (excluding high income)Sub-Saharan Africa (IDA & IBRD countries)SudanSwedenSwitzerlandSyrian Arab RepublicTajikistanTanzaniaThailandTogoTunisiaTurkeyTurkmenistanUgandaUkraineUnited Arab EmiratesUnited KingdomUnited StatesUpper middle incomeUruguayUzbekistanVenezuela, RBVietnamWest Bank and GazaWorldYemen, Rep.ZambiaZimbabwe línea de tiempo (timeline):
En esta escala de tiempo se presenta un gráfico de 1961 y 2016 de Heavily indebted poor countries (HIPC). Los datos de 1960 están ausentes. El número de observaciones reales por fecha: 56.
Fuente (nombre):
Indicadores del desarrollo mundial
Fuente (organización):
United Nations, World Urbanization Prospects.
Categorías:
Urban Development
Se ha actualizado:
23 abr 2017 año
Los indicadores de los cambios de valor en los últimos años
Mínimo:
30.273
1 ene 1961 año
Máximo:
37.178
1 ene 1989 año
A la fecha de observación
Valor
Cambio absoluto
El cambio con respecto al valor anterior
1 ene 1961 año
30.273
+30.273
0.0%
1 ene 1962 año
30.627
+0.354
1.17%
1 ene 1963 año
30.948
+0.321
1.05%
1 ene 1964 año
31.23
+0.282
0.91%
1 ene 1965 año
31.58
+0.35
1.12%
1 ene 1966 año
31.964
+0.383
1.21%
1 ene 1967 año
32.4
+0.437
1.37%
1 ene 1968 año
32.835
+0.434
1.34%
1 ene 1969 año
33.267
+0.433
1.32%
1 ene 1970 año
33.706
+0.439
1.32%
1 ene 1971 año
34.114
+0.408
1.21%
1 ene 1972 año
34.481
+0.367
1.08%
1 ene 1973 año
34.849
+0.368
1.07%
1 ene 1974 año
35.201
+0.352
1.01%
1 ene 1975 año
35.537
+0.336
0.95%
1 ene 1976 año
35.849
+0.312
0.88%
1 ene 1977 año
36.066
+0.217
0.6%
1 ene 1978 año
36.23
+0.164
0.45%
1 ene 1979 año
36.365
+0.135
0.37%
1 ene 1980 año
36.47
+0.106
0.29%
1 ene 1981 año
36.551
+0.08
0.22%
1 ene 1982 año
36.652
+0.101
0.28%
1 ene 1983 año
36.764
+0.112
0.31%
1 ene 1984 año
36.897
+0.134
0.36%
1 ene 1985 año
37.035
+0.138
0.37%
1 ene 1986 año
37.073
+0.038
0.1%
1 ene 1987 año
37.107
+0.034
0.09%
1 ene 1988 año
37.144
+0.037
0.1%
1 ene 1989 año
37.178
+0.034
0.09%
1 ene 1990 año
37.156
-0.021
-0.06%
1 ene 1991 año
37.11
-0.046
-0.12%
1 ene 1992 año
37.097
-0.013
-0.04%
1 ene 1993 año
36.605
-0.492
-1.33%
1 ene 1994 año
36.202
-0.403
-1.1%
1 ene 1995 año
35.844
-0.358
-0.99%
1 ene 1996 año
35.56
-0.284
-0.79%
1 ene 1997 año
35.724
+0.164
0.46%
1 ene 1998 año
35.557
-0.167
-0.47%
1 ene 1999 año
35.429
-0.128
-0.36%
1 ene 2000 año
35.278
-0.15
-0.42%
1 ene 2001 año
35.232
-0.046
-0.13%
1 ene 2002 año
35.146
-0.086
-0.25%
1 ene 2003 año
35.073
-0.073
-0.21%
1 ene 2004 año
34.953
-0.12
-0.34%
1 ene 2005 año
34.842
-0.111
-0.32%
1 ene 2006 año
34.579
-0.262
-0.75%
1 ene 2007 año
34.362
-0.217
-0.63%
1 ene 2008 año
33.918
-0.444
-1.29%
1 ene 2009 año
33.758
-0.16
-0.47%
1 ene 2010 año
33.655
-0.103
-0.31%
1 ene 2011 año
33.256
-0.399
-1.19%
1 ene 2012 año
33.18
-0.076
-0.23%
1 ene 2013 año
33.147
-0.033
-0.1%
1 ene 2014 año
33.127
-0.02
-0.06%
1 ene 2015 año
33.14
+0.013
0.04%
1 ene 2016 año
33.079
-0.061
-0.18%
Ranking de los países por los datos estadísticos actuales


Comentarios: