29
/es/
es
AIzaSyAYiBZKx7MnpbEhh9jyipgxe19OcubqV5w
April 1, 2024
49043
Middle East & North Africa (excluding high income)
MNA
false
2
1
Gross fixed capital formation (% of GDP)
2015,2014,2013,2012,2011,2010,2009,2008,2007,2006,2005,2004,2003,2002,2001,2000,1999,1998,1997,1996,1995,1994,1993,1992,1991,1990,1989,1988,1987,1986,1985,1984,1983,1982,1981,1980,1979,1978,1977,1976,1975,1974,1973,1972,1971,1970
Estas estadísticas en otros países:
AfghanistanAlbaniaAlgeriaAngolaAntigua and BarbudaArab WorldArgentinaArmeniaArubaAustraliaAustriaAzerbaijanBahamas, TheBahrainBangladeshBarbadosBelarusBelgiumBelizeBeninBermudaBhutanBoliviaBosnia and HerzegovinaBotswanaBrazilBrunei DarussalamBulgariaBurkina FasoBurundiCabo VerdeCambodiaCameroonCanadaCaribbean small statesCentral African RepublicCentral Europe and the BalticsChadChileChinaColombiaComorosCongo, Dem. Rep.Congo, Rep.Costa RicaCote d'IvoireCroatiaCubaCyprusCzech RepublicDenmarkDjiboutiDominicaDominican RepublicEarly-demographic dividendEast Asia & PacificEast Asia & Pacific (excluding high income)East Asia & Pacific (IDA & IBRD countries)EcuadorEgypt, Arab Rep.El SalvadorEquatorial GuineaEritreaEstoniaEthiopiaEuro areaEurope & Central AsiaEurope & Central Asia (excluding high income)Europe & Central Asia (IDA & IBRD countries)European UnionFijiFinlandFragile and conflict affected situationsFranceGabonGambia, TheGeorgiaGermanyGhanaGreeceGrenadaGuatemalaGuineaGuinea-BissauGuyanaHaitiHeavily indebted poor countries (HIPC)High incomeHondurasHong Kong SAR, ChinaHungaryIBRD onlyIcelandIDA & IBRD totalIDA blendIDA onlyIDA totalIndiaIndonesiaIran, Islamic Rep.IraqIrelandIsraelItalyJamaicaJapanJordanKazakhstanKenyaKiribatiKorea, Rep.KosovoKuwaitKyrgyz RepublicLao PDRLate-demographic dividendLatin America & Caribbean Latin America & Caribbean (excluding high income)Latin America & the Caribbean (IDA & IBRD countries)LatviaLeast developed countries: UN classificationLebanonLesothoLiberiaLibyaLithuaniaLow & middle incomeLow incomeLower middle incomeLuxembourgMacao SAR, ChinaMacedonia, FYRMadagascarMalawiMalaysiaMaldivesMaliMaltaMauritaniaMauritiusMexicoMicronesia, Fed. Sts.Middle East & North AfricaMiddle East & North Africa (excluding high income)Middle East & North Africa (IDA & IBRD countries)Middle incomeMoldovaMongoliaMontenegroMoroccoMozambiqueNamibiaNepalNetherlandsNew CaledoniaNew ZealandNicaraguaNigerNigeriaNorth AmericaNorwayOECD membersOmanPacific island small statesPakistanPanamaPapua New GuineaParaguayPeruPhilippinesPolandPortugalPost-demographic dividendPre-demographic dividendPuerto RicoRomaniaRussian FederationRwandaSaudi ArabiaSenegalSerbiaSeychellesSierra LeoneSingaporeSlovak RepublicSloveniaSolomon IslandsSomaliaSouth AfricaSouth AsiaSouth Asia (IDA & IBRD)South SudanSpainSri LankaSt. Kitts and NevisSt. LuciaSt. Vincent and the GrenadinesSub-Saharan Africa Sub-Saharan Africa (excluding high income)Sub-Saharan Africa (IDA & IBRD countries)SudanSurinameSwazilandSwedenSwitzerlandSyrian Arab RepublicTajikistanTanzaniaThailandTimor-LesteTogoTongaTrinidad and TobagoTunisiaTurkeyTurkmenistanUgandaUkraineUnited Arab EmiratesUnited KingdomUnited StatesUpper middle incomeUruguayUzbekistanVanuatuVenezuela, RBVietnamWest Bank and GazaWorldYemen, Rep.ZambiaZimbabwe línea de tiempo (timeline):
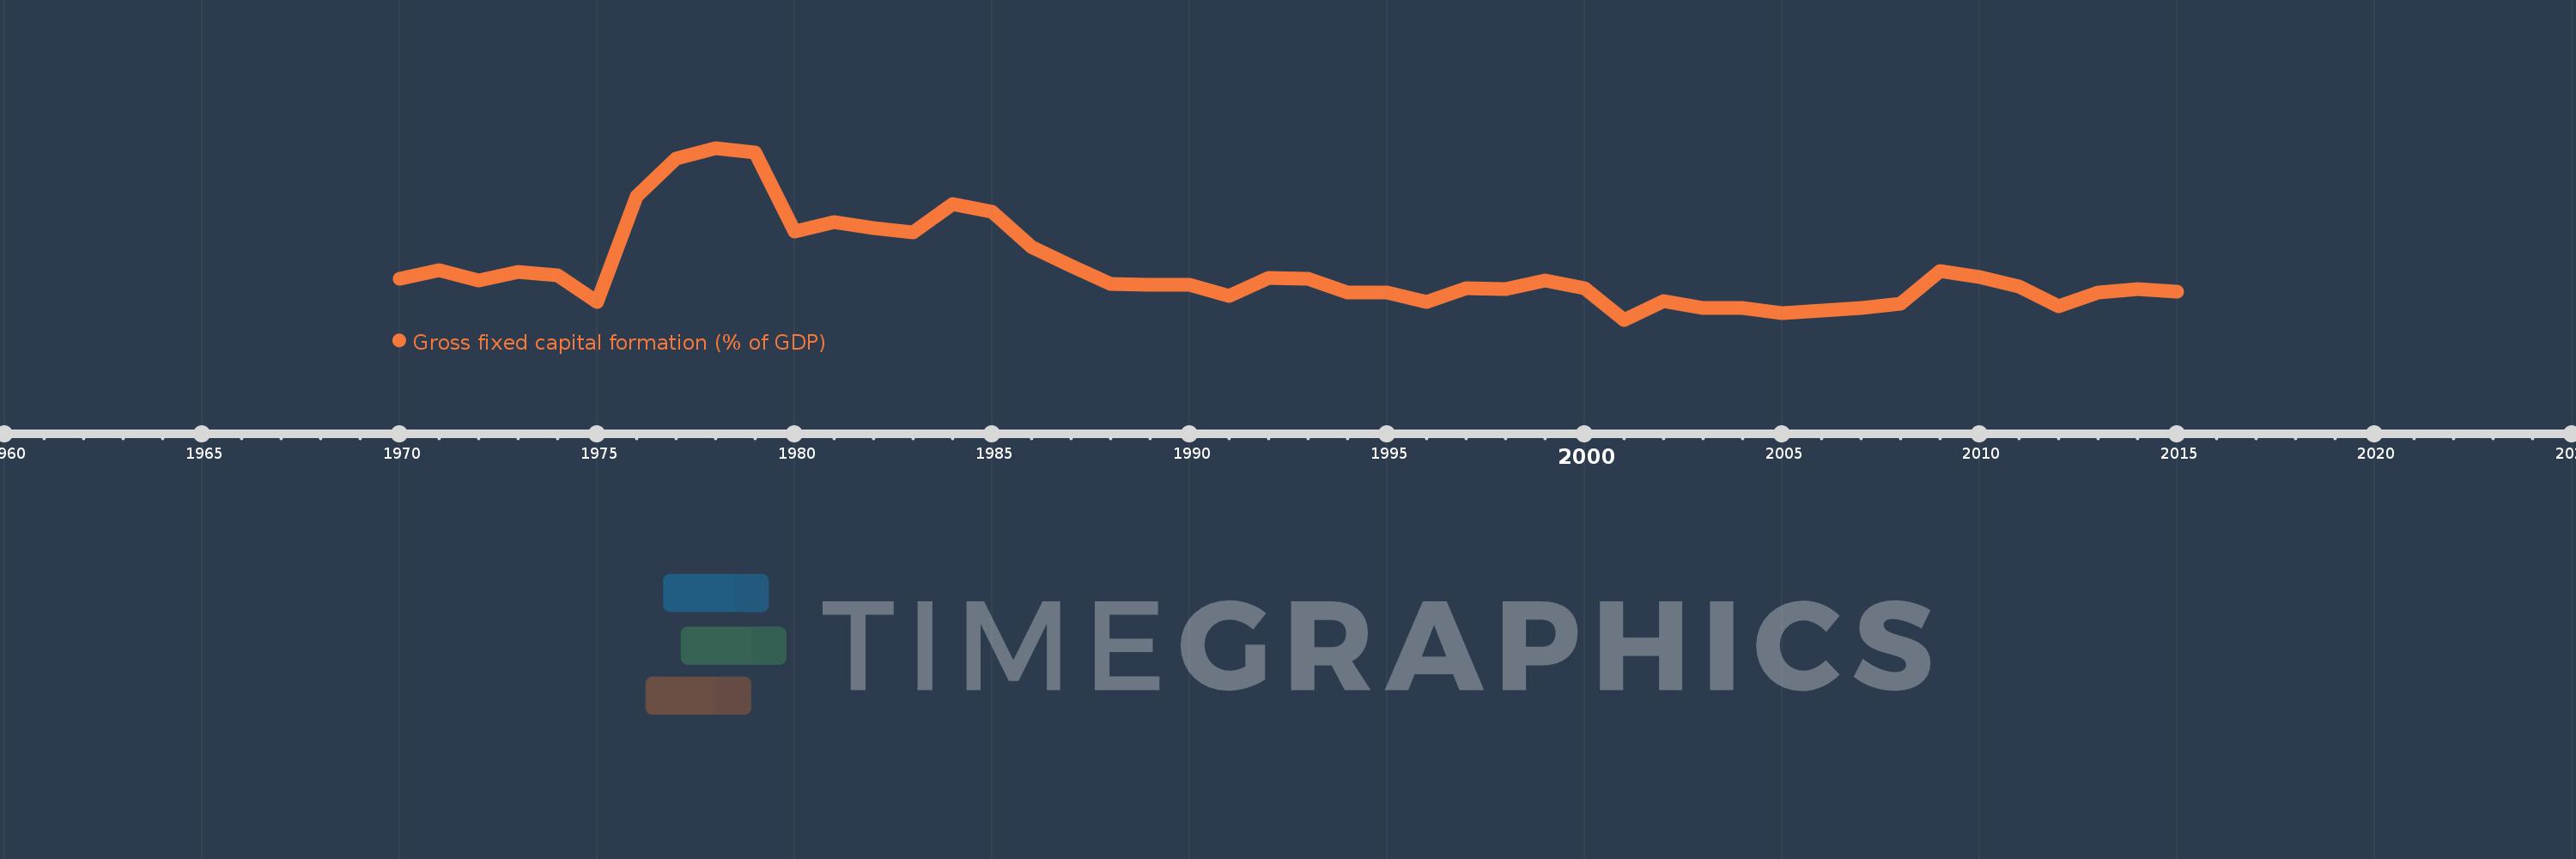
En esta escala de tiempo se presenta un gráfico de 1970 y 2015 de Middle East & North Africa (excluding high income). Los datos de 1969 están ausentes. El número de observaciones reales por fecha: 46.
Fuente (nombre):
Indicadores del desarrollo mundial
Fuente (organización):
World Bank national accounts data, and OECD National Accounts data files.
Categorías:
Economy & Growth
Se ha actualizado:
23 abr 2017 año
Los indicadores de los cambios de valor en los últimos años
Mínimo:
22.156
1 ene 2001 año
Máximo:
40.009
1 ene 1978 año
A la fecha de observación
Valor
Cambio absoluto
El cambio con respecto al valor anterior
1 ene 1970 año
26.441
+26.441
0.0%
1 ene 1971 año
27.342
+0.901
3.41%
1 ene 1972 año
26.25
-1.092
-4.0%
1 ene 1973 año
27.113
+0.863
3.29%
1 ene 1974 año
26.744
-0.369
-1.36%
1 ene 1975 año
24.044
-2.7
-10.1%
1 ene 1976 año
34.991
+10.947
45.53%
1 ene 1977 año
38.927
+3.936
11.25%
1 ene 1978 año
40.009
+1.082
2.78%
1 ene 1979 año
39.571
-0.438
-1.09%
1 ene 1980 año
31.303
-8.268
-20.89%
1 ene 1981 año
32.27
+0.967
3.09%
1 ene 1982 año
31.691
-0.578
-1.79%
1 ene 1983 año
31.226
-0.465
-1.47%
1 ene 1984 año
34.215
+2.989
9.57%
1 ene 1985 año
33.387
-0.828
-2.42%
1 ene 1986 año
29.686
-3.701
-11.08%
1 ene 1987 año
27.789
-1.898
-6.39%
1 ene 1988 año
25.9
-1.889
-6.8%
1 ene 1989 año
25.772
-0.128
-0.49%
1 ene 1990 año
25.833
+0.061
0.24%
1 ene 1991 año
24.652
-1.181
-4.57%
1 ene 1992 año
26.517
+1.865
7.57%
1 ene 1993 año
26.437
-0.08
-0.3%
1 ene 1994 año
25.008
-1.43
-5.41%
1 ene 1995 año
24.961
-0.046
-0.18%
1 ene 1996 año
24.028
-0.934
-3.74%
1 ene 1997 año
25.422
+1.394
5.8%
1 ene 1998 año
25.355
-0.067
-0.26%
1 ene 1999 año
26.267
+0.913
3.6%
1 ene 2000 año
25.397
-0.87
-3.31%
1 ene 2001 año
22.156
-3.241
-12.76%
1 ene 2002 año
24.055
+1.899
8.57%
1 ene 2003 año
23.398
-0.657
-2.73%
1 ene 2004 año
23.378
-0.019
-0.08%
1 ene 2005 año
22.835
-0.544
-2.33%
1 ene 2006 año
23.098
+0.264
1.16%
1 ene 2007 año
23.412
+0.314
1.36%
1 ene 2008 año
23.835
+0.423
1.81%
1 ene 2009 año
27.175
+3.34
14.01%
1 ene 2010 año
26.564
-0.611
-2.25%
1 ene 2011 año
25.65
-0.914
-3.44%
1 ene 2012 año
23.555
-2.095
-8.17%
1 ene 2013 año
24.993
+1.438
6.1%
1 ene 2014 año
25.327
+0.335
1.34%
1 ene 2015 año
25.11
-0.217
-0.86%
Ranking de los países por los datos estadísticos actuales


Comentarios: