29
/es/
es
AIzaSyAYiBZKx7MnpbEhh9jyipgxe19OcubqV5w
April 1, 2024
134166
France
FRA
true
2
1
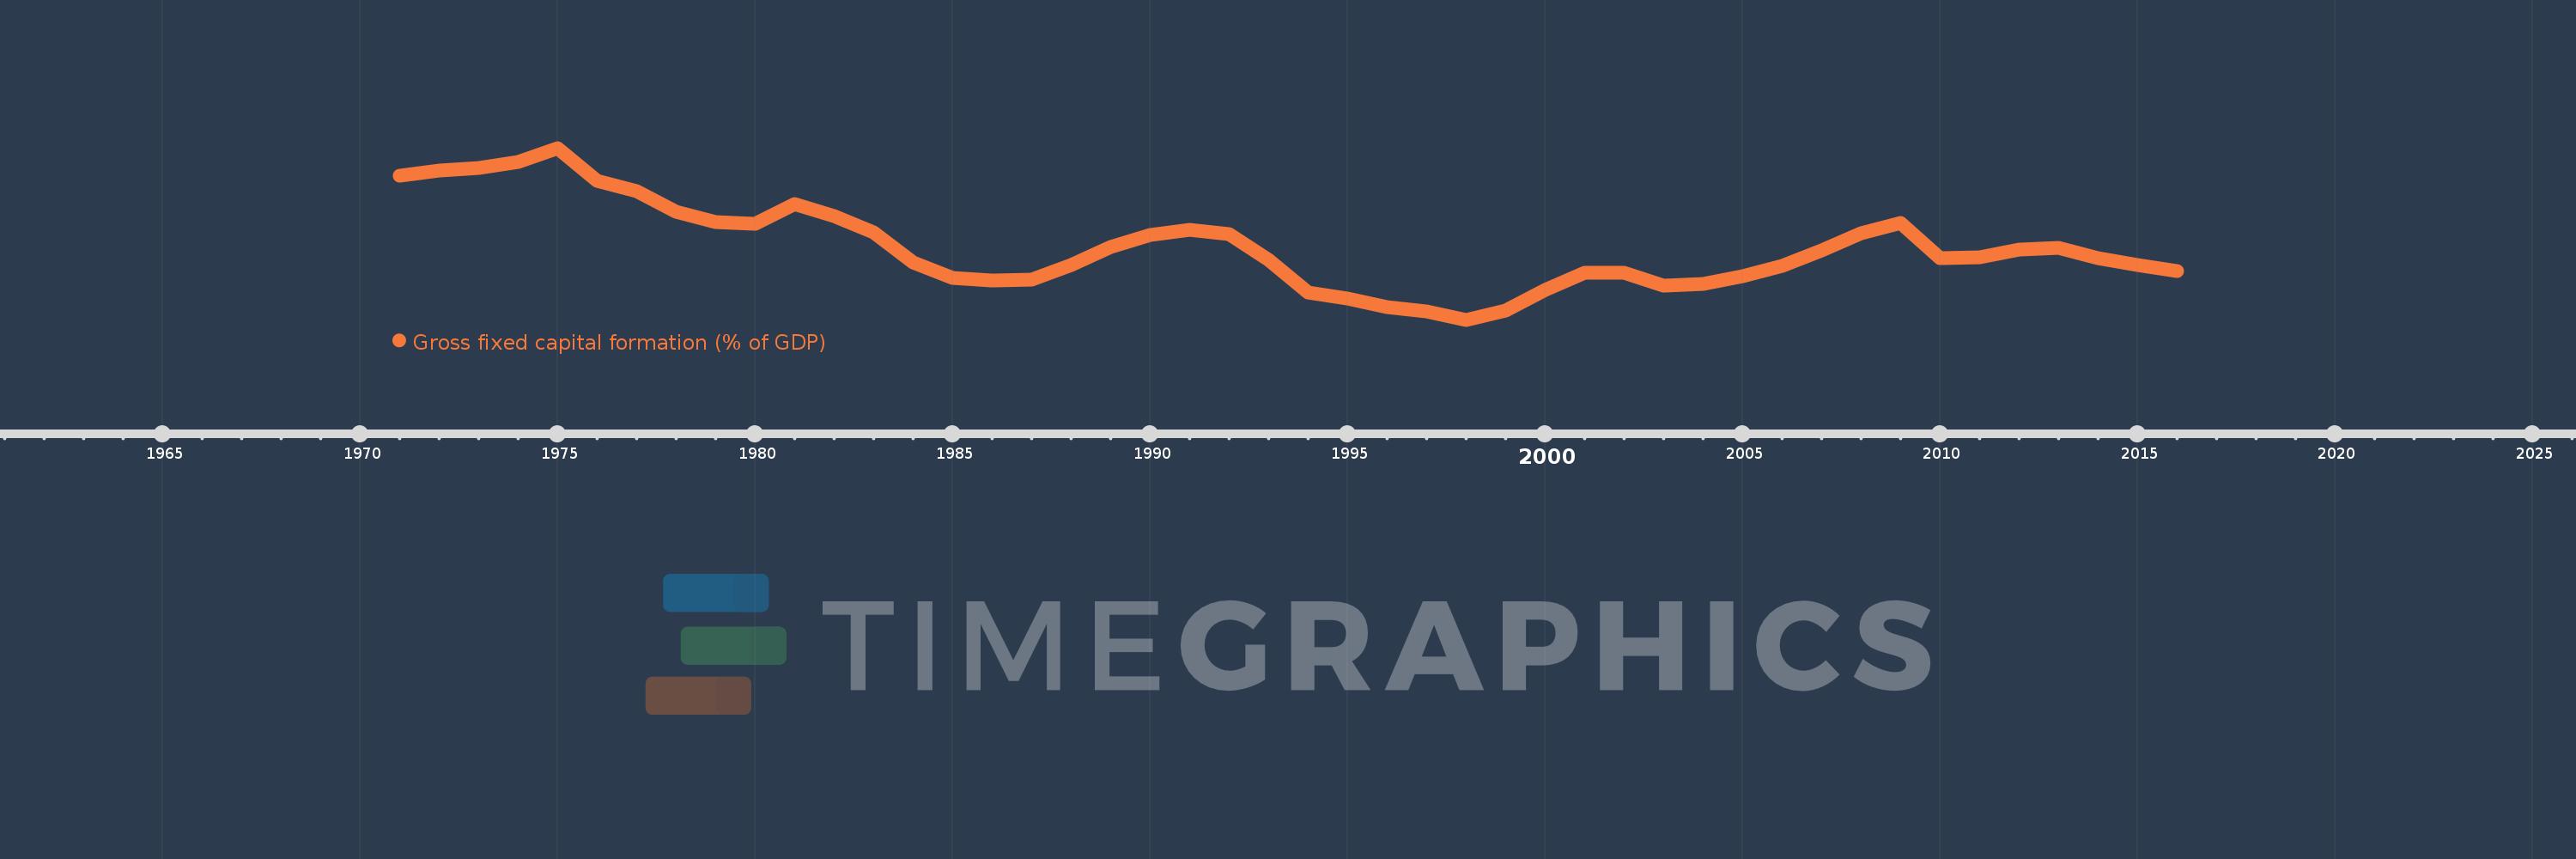
Gross fixed capital formation (% of GDP)
2016,2015,2014,2013,2012,2011,2010,2009,2008,2007,2006,2005,2004,2003,2002,2001,2000,1999,1998,1997,1996,1995,1994,1993,1992,1991,1990,1989,1988,1987,1986,1985,1984,1983,1982,1981,1980,1979,1978,1977,1976,1975,1974,1973,1972,1971
Estas estadísticas en otros países:
AfghanistanAlbaniaAlgeriaAngolaAntigua and BarbudaArab WorldArgentinaArmeniaArubaAustraliaAustriaAzerbaijanBahamas, TheBahrainBangladeshBarbadosBelarusBelgiumBelizeBeninBermudaBhutanBoliviaBosnia and HerzegovinaBotswanaBrazilBrunei DarussalamBulgariaBurkina FasoBurundiCabo VerdeCambodiaCameroonCanadaCaribbean small statesCentral African RepublicCentral Europe and the BalticsChadChileChinaColombiaComorosCongo, Dem. Rep.Congo, Rep.Costa RicaCote d'IvoireCroatiaCubaCyprusCzech RepublicDenmarkDjiboutiDominicaDominican RepublicEarly-demographic dividendEast Asia & PacificEast Asia & Pacific (excluding high income)East Asia & Pacific (IDA & IBRD countries)EcuadorEgypt, Arab Rep.El SalvadorEquatorial GuineaEritreaEstoniaEthiopiaEuro areaEurope & Central AsiaEurope & Central Asia (excluding high income)Europe & Central Asia (IDA & IBRD countries)European UnionFijiFinlandFragile and conflict affected situationsFranceGabonGambia, TheGeorgiaGermanyGhanaGreeceGrenadaGuatemalaGuineaGuinea-BissauGuyanaHaitiHeavily indebted poor countries (HIPC)High incomeHondurasHong Kong SAR, ChinaHungaryIBRD onlyIcelandIDA & IBRD totalIDA blendIDA onlyIDA totalIndiaIndonesiaIran, Islamic Rep.IraqIrelandIsraelItalyJamaicaJapanJordanKazakhstanKenyaKiribatiKorea, Rep.KosovoKuwaitKyrgyz RepublicLao PDRLate-demographic dividendLatin America & Caribbean Latin America & Caribbean (excluding high income)Latin America & the Caribbean (IDA & IBRD countries)LatviaLeast developed countries: UN classificationLebanonLesothoLiberiaLibyaLithuaniaLow & middle incomeLow incomeLower middle incomeLuxembourgMacao SAR, ChinaMacedonia, FYRMadagascarMalawiMalaysiaMaldivesMaliMaltaMauritaniaMauritiusMexicoMicronesia, Fed. Sts.Middle East & North AfricaMiddle East & North Africa (excluding high income)Middle East & North Africa (IDA & IBRD countries)Middle incomeMoldovaMongoliaMontenegroMoroccoMozambiqueNamibiaNepalNetherlandsNew CaledoniaNew ZealandNicaraguaNigerNigeriaNorth AmericaNorwayOECD membersOmanPacific island small statesPakistanPanamaPapua New GuineaParaguayPeruPhilippinesPolandPortugalPost-demographic dividendPre-demographic dividendPuerto RicoRomaniaRussian FederationRwandaSaudi ArabiaSenegalSerbiaSeychellesSierra LeoneSingaporeSlovak RepublicSloveniaSolomon IslandsSomaliaSouth AfricaSouth AsiaSouth Asia (IDA & IBRD)South SudanSpainSri LankaSt. Kitts and NevisSt. LuciaSt. Vincent and the GrenadinesSub-Saharan Africa Sub-Saharan Africa (excluding high income)Sub-Saharan Africa (IDA & IBRD countries)SudanSurinameSwazilandSwedenSwitzerlandSyrian Arab RepublicTajikistanTanzaniaThailandTimor-LesteTogoTongaTrinidad and TobagoTunisiaTurkeyTurkmenistanUgandaUkraineUnited Arab EmiratesUnited KingdomUnited StatesUpper middle incomeUruguayUzbekistanVanuatuVenezuela, RBVietnamWest Bank and GazaWorldYemen, Rep.ZambiaZimbabwe línea de tiempo (timeline):
En esta escala de tiempo se presenta un gráfico de 1971 y 2016 de France. Los datos de 1970 están ausentes. El número de observaciones reales por fecha: 46.
Fuente (nombre):
Indicadores del desarrollo mundial
Fuente (organización):
World Bank national accounts data, and OECD National Accounts data files.
Categorías:
Economy & Growth
Se ha actualizado:
23 abr 2017 año
Los indicadores de los cambios de valor en los últimos años
Mínimo:
19.415
1 ene 1998 año
Máximo:
26.761
1 ene 1975 año
A la fecha de observación
Valor
Cambio absoluto
El cambio con respecto al valor anterior
1 ene 1971 año
25.59
+25.59
0.0%
1 ene 1972 año
25.798
+0.208
0.81%
1 ene 1973 año
25.907
+0.109
0.42%
1 ene 1974 año
26.162
+0.254
0.98%
1 ene 1975 año
26.761
+0.599
2.29%
1 ene 1976 año
25.348
-1.413
-5.28%
1 ene 1977 año
24.923
-0.425
-1.68%
1 ene 1978 año
24.032
-0.891
-3.57%
1 ene 1979 año
23.589
-0.443
-1.84%
1 ene 1980 año
23.515
-0.074
-0.32%
1 ene 1981 año
24.35
+0.836
3.55%
1 ene 1982 año
23.84
-0.511
-2.1%
1 ene 1983 año
23.168
-0.672
-2.82%
1 ene 1984 año
21.863
-1.304
-5.63%
1 ene 1985 año
21.216
-0.647
-2.96%
1 ene 1986 año
21.102
-0.113
-0.53%
1 ene 1987 año
21.142
+0.039
0.19%
1 ene 1988 año
21.758
+0.616
2.91%
1 ene 1989 año
22.516
+0.759
3.49%
1 ene 1990 año
23.054
+0.538
2.39%
1 ene 1991 año
23.27
+0.216
0.94%
1 ene 1992 año
23.064
-0.206
-0.89%
1 ene 1993 año
21.967
-1.097
-4.76%
1 ene 1994 año
20.593
-1.374
-6.26%
1 ene 1995 año
20.312
-0.281
-1.36%
1 ene 1996 año
19.964
-0.348
-1.71%
1 ene 1997 año
19.755
-0.21
-1.05%
1 ene 1998 año
19.415
-0.34
-1.72%
1 ene 1999 año
19.8
+0.385
1.99%
1 ene 2000 año
20.703
+0.903
4.56%
1 ene 2001 año
21.417
+0.714
3.45%
1 ene 2002 año
21.424
+0.007
0.03%
1 ene 2003 año
20.869
-0.555
-2.59%
1 ene 2004 año
20.948
+0.079
0.38%
1 ene 2005 año
21.28
+0.333
1.59%
1 ene 2006 año
21.723
+0.442
2.08%
1 ene 2007 año
22.389
+0.666
3.07%
1 ene 2008 año
23.131
+0.743
3.32%
1 ene 2009 año
23.555
+0.424
1.83%
1 ene 2010 año
22.038
-1.517
-6.44%
1 ene 2011 año
22.07
+0.032
0.15%
1 ene 2012 año
22.414
+0.344
1.56%
1 ene 2013 año
22.478
+0.064
0.29%
1 ene 2014 año
22.062
-0.416
-1.85%
1 ene 2015 año
21.772
-0.29
-1.32%
1 ene 2016 año
21.511
-0.26
-1.2%
Ranking de los países por los datos estadísticos actuales


Comentarios: