29
/es/
es
AIzaSyAYiBZKx7MnpbEhh9jyipgxe19OcubqV5w
April 1, 2024
205325
Namibia
NAM
true
2
1
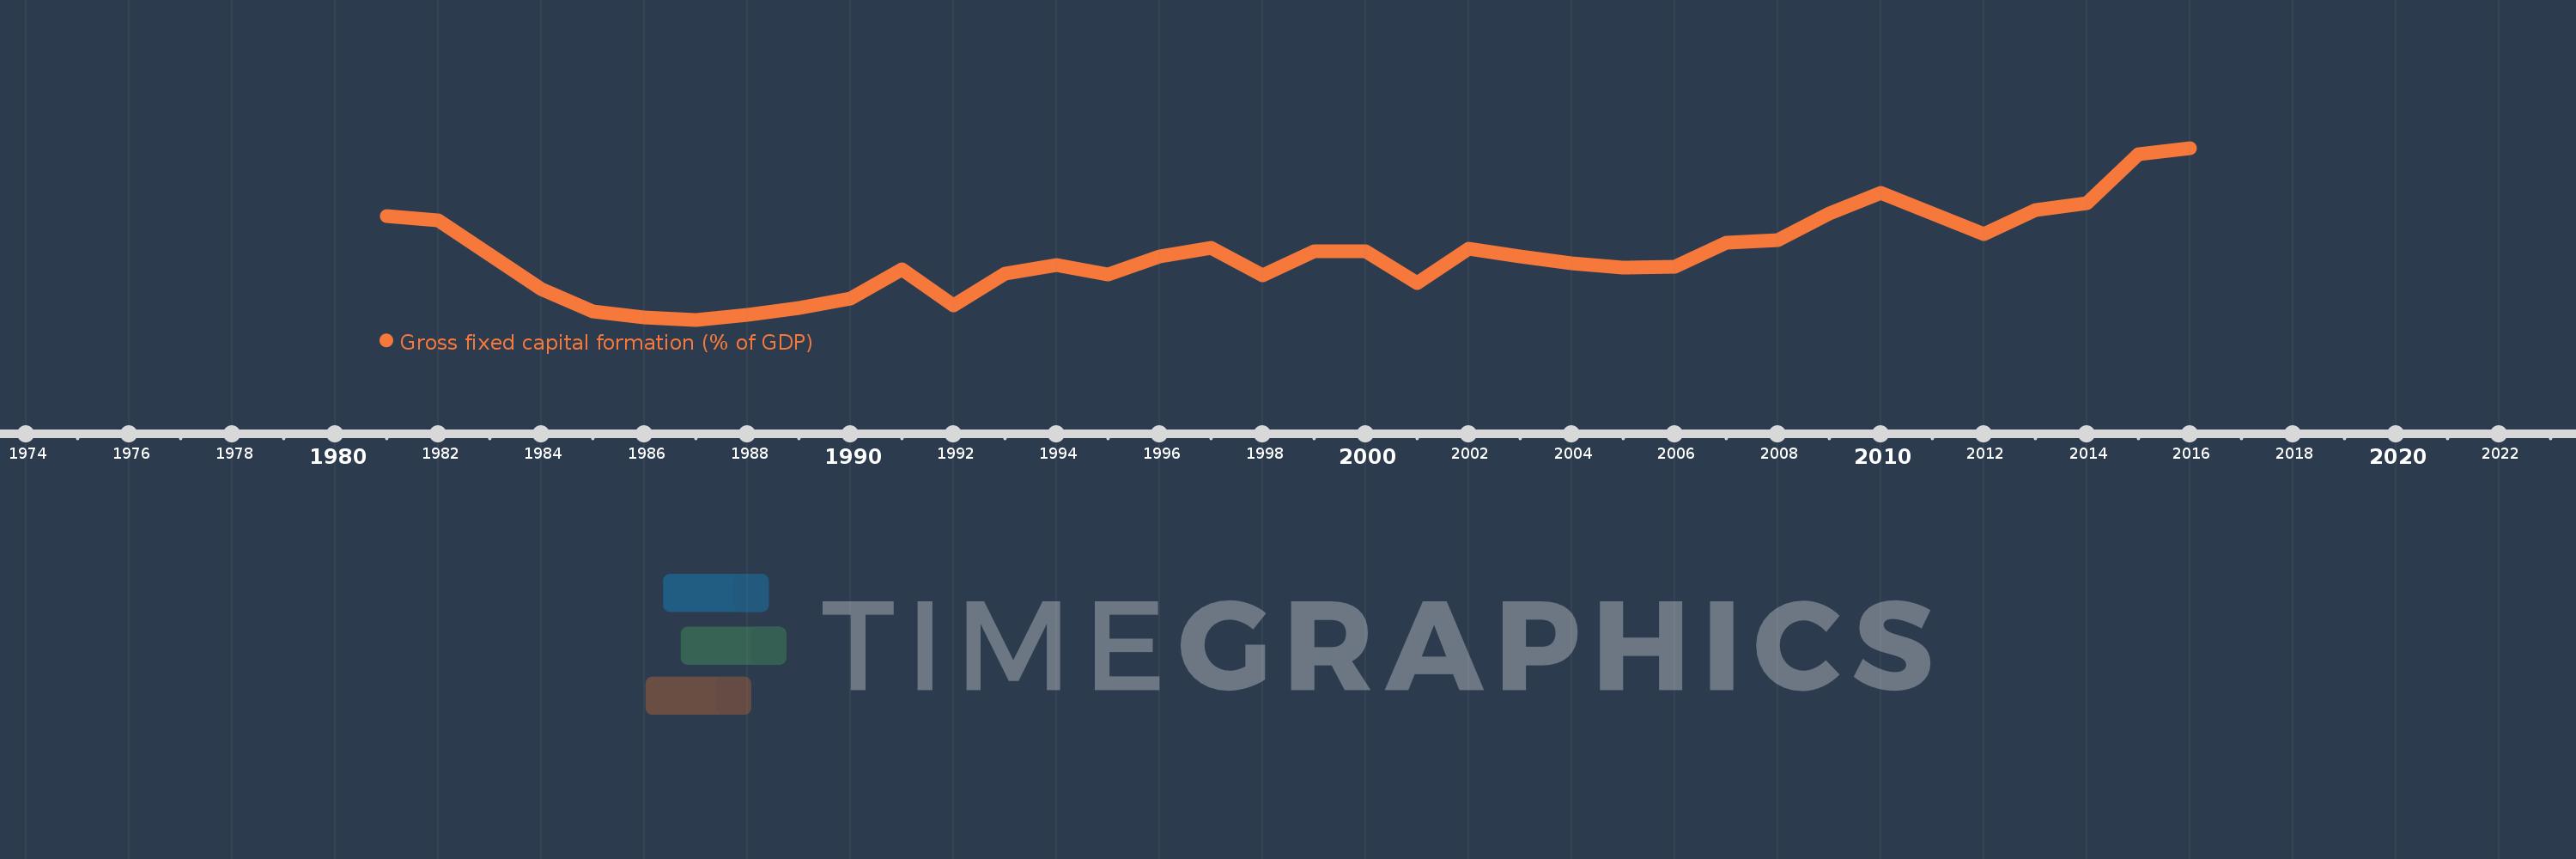
Gross fixed capital formation (% of GDP)
2016,2015,2014,2013,2012,2011,2010,2009,2008,2007,2006,2005,2004,2003,2002,2001,2000,1999,1998,1997,1996,1995,1994,1993,1992,1991,1990,1989,1988,1987,1986,1985,1984,1983,1982,1981
Estas estadísticas en otros países:
AfghanistanAlbaniaAlgeriaAngolaAntigua and BarbudaArab WorldArgentinaArmeniaArubaAustraliaAustriaAzerbaijanBahamas, TheBahrainBangladeshBarbadosBelarusBelgiumBelizeBeninBermudaBhutanBoliviaBosnia and HerzegovinaBotswanaBrazilBrunei DarussalamBulgariaBurkina FasoBurundiCabo VerdeCambodiaCameroonCanadaCaribbean small statesCentral African RepublicCentral Europe and the BalticsChadChileChinaColombiaComorosCongo, Dem. Rep.Congo, Rep.Costa RicaCote d'IvoireCroatiaCubaCyprusCzech RepublicDenmarkDjiboutiDominicaDominican RepublicEarly-demographic dividendEast Asia & PacificEast Asia & Pacific (excluding high income)East Asia & Pacific (IDA & IBRD countries)EcuadorEgypt, Arab Rep.El SalvadorEquatorial GuineaEritreaEstoniaEthiopiaEuro areaEurope & Central AsiaEurope & Central Asia (excluding high income)Europe & Central Asia (IDA & IBRD countries)European UnionFijiFinlandFragile and conflict affected situationsFranceGabonGambia, TheGeorgiaGermanyGhanaGreeceGrenadaGuatemalaGuineaGuinea-BissauGuyanaHaitiHeavily indebted poor countries (HIPC)High incomeHondurasHong Kong SAR, ChinaHungaryIBRD onlyIcelandIDA & IBRD totalIDA blendIDA onlyIDA totalIndiaIndonesiaIran, Islamic Rep.IraqIrelandIsraelItalyJamaicaJapanJordanKazakhstanKenyaKiribatiKorea, Rep.KosovoKuwaitKyrgyz RepublicLao PDRLate-demographic dividendLatin America & Caribbean Latin America & Caribbean (excluding high income)Latin America & the Caribbean (IDA & IBRD countries)LatviaLeast developed countries: UN classificationLebanonLesothoLiberiaLibyaLithuaniaLow & middle incomeLow incomeLower middle incomeLuxembourgMacao SAR, ChinaMacedonia, FYRMadagascarMalawiMalaysiaMaldivesMaliMaltaMauritaniaMauritiusMexicoMicronesia, Fed. Sts.Middle East & North AfricaMiddle East & North Africa (excluding high income)Middle East & North Africa (IDA & IBRD countries)Middle incomeMoldovaMongoliaMontenegroMoroccoMozambiqueNamibiaNepalNetherlandsNew CaledoniaNew ZealandNicaraguaNigerNigeriaNorth AmericaNorwayOECD membersOmanPacific island small statesPakistanPanamaPapua New GuineaParaguayPeruPhilippinesPolandPortugalPost-demographic dividendPre-demographic dividendPuerto RicoRomaniaRussian FederationRwandaSaudi ArabiaSenegalSerbiaSeychellesSierra LeoneSingaporeSlovak RepublicSloveniaSolomon IslandsSomaliaSouth AfricaSouth AsiaSouth Asia (IDA & IBRD)South SudanSpainSri LankaSt. Kitts and NevisSt. LuciaSt. Vincent and the GrenadinesSub-Saharan Africa Sub-Saharan Africa (excluding high income)Sub-Saharan Africa (IDA & IBRD countries)SudanSurinameSwazilandSwedenSwitzerlandSyrian Arab RepublicTajikistanTanzaniaThailandTimor-LesteTogoTongaTrinidad and TobagoTunisiaTurkeyTurkmenistanUgandaUkraineUnited Arab EmiratesUnited KingdomUnited StatesUpper middle incomeUruguayUzbekistanVanuatuVenezuela, RBVietnamWest Bank and GazaWorldYemen, Rep.ZambiaZimbabwe línea de tiempo (timeline):
En esta escala de tiempo se presenta un gráfico de 1981 y 2016 de Namibia. Los datos de 1980 están ausentes. El número de observaciones reales por fecha: 36.
Fuente (nombre):
Indicadores del desarrollo mundial
Fuente (organización):
World Bank national accounts data, and OECD National Accounts data files.
Categorías:
Economy & Growth
Se ha actualizado:
23 abr 2017 año
Los indicadores de los cambios de valor en los últimos años
Mínimo:
11.945
1 ene 1987 año
Máximo:
33.578
1 ene 2016 año
A la fecha de observación
Valor
Cambio absoluto
El cambio con respecto al valor anterior
1 ene 1981 año
24.969
+24.969
0.0%
1 ene 1982 año
24.473
-0.496
-1.99%
1 ene 1983 año
20.121
-4.352
-17.78%
1 ene 1984 año
15.819
-4.302
-21.38%
1 ene 1985 año
13.008
-2.811
-17.77%
1 ene 1986 año
12.194
-0.814
-6.25%
1 ene 1987 año
11.945
-0.249
-2.04%
1 ene 1988 año
12.521
+0.575
4.82%
1 ene 1989 año
13.419
+0.898
7.18%
1 ene 1990 año
14.668
+1.249
9.31%
1 ene 1991 año
18.338
+3.67
25.02%
1 ene 1992 año
13.734
-4.604
-25.11%
1 ene 1993 año
17.719
+3.985
29.02%
1 ene 1994 año
18.86
+1.141
6.44%
1 ene 1995 año
17.614
-1.246
-6.6%
1 ene 1996 año
19.868
+2.253
12.79%
1 ene 1997 año
21.022
+1.154
5.81%
1 ene 1998 año
17.544
-3.477
-16.54%
1 ene 1999 año
20.604
+3.06
17.44%
1 ene 2000 año
20.575
-0.028
-0.14%
1 ene 2001 año
16.583
-3.993
-19.41%
1 ene 2002 año
20.931
+4.348
26.22%
1 ene 2003 año
19.943
-0.988
-4.72%
1 ene 2004 año
19.088
-0.855
-4.29%
1 ene 2005 año
18.562
-0.527
-2.76%
1 ene 2006 año
18.613
+0.051
0.28%
1 ene 2007 año
21.63
+3.016
16.21%
1 ene 2008 año
22.009
+0.38
1.76%
1 ene 2009 año
25.318
+3.309
15.03%
1 ene 2010 año
27.953
+2.636
10.41%
1 ene 2011 año
25.284
-2.67
-9.55%
1 ene 2012 año
22.699
-2.585
-10.22%
1 ene 2013 año
25.747
+3.048
13.43%
1 ene 2014 año
26.663
+0.916
3.56%
1 ene 2015 año
32.806
+6.143
23.04%
1 ene 2016 año
33.578
+0.772
2.35%
Ranking de los países por los datos estadísticos actuales


Comentarios: