29
/es/
es
AIzaSyAYiBZKx7MnpbEhh9jyipgxe19OcubqV5w
April 1, 2024
153598
Iceland
ISL
true
2
1
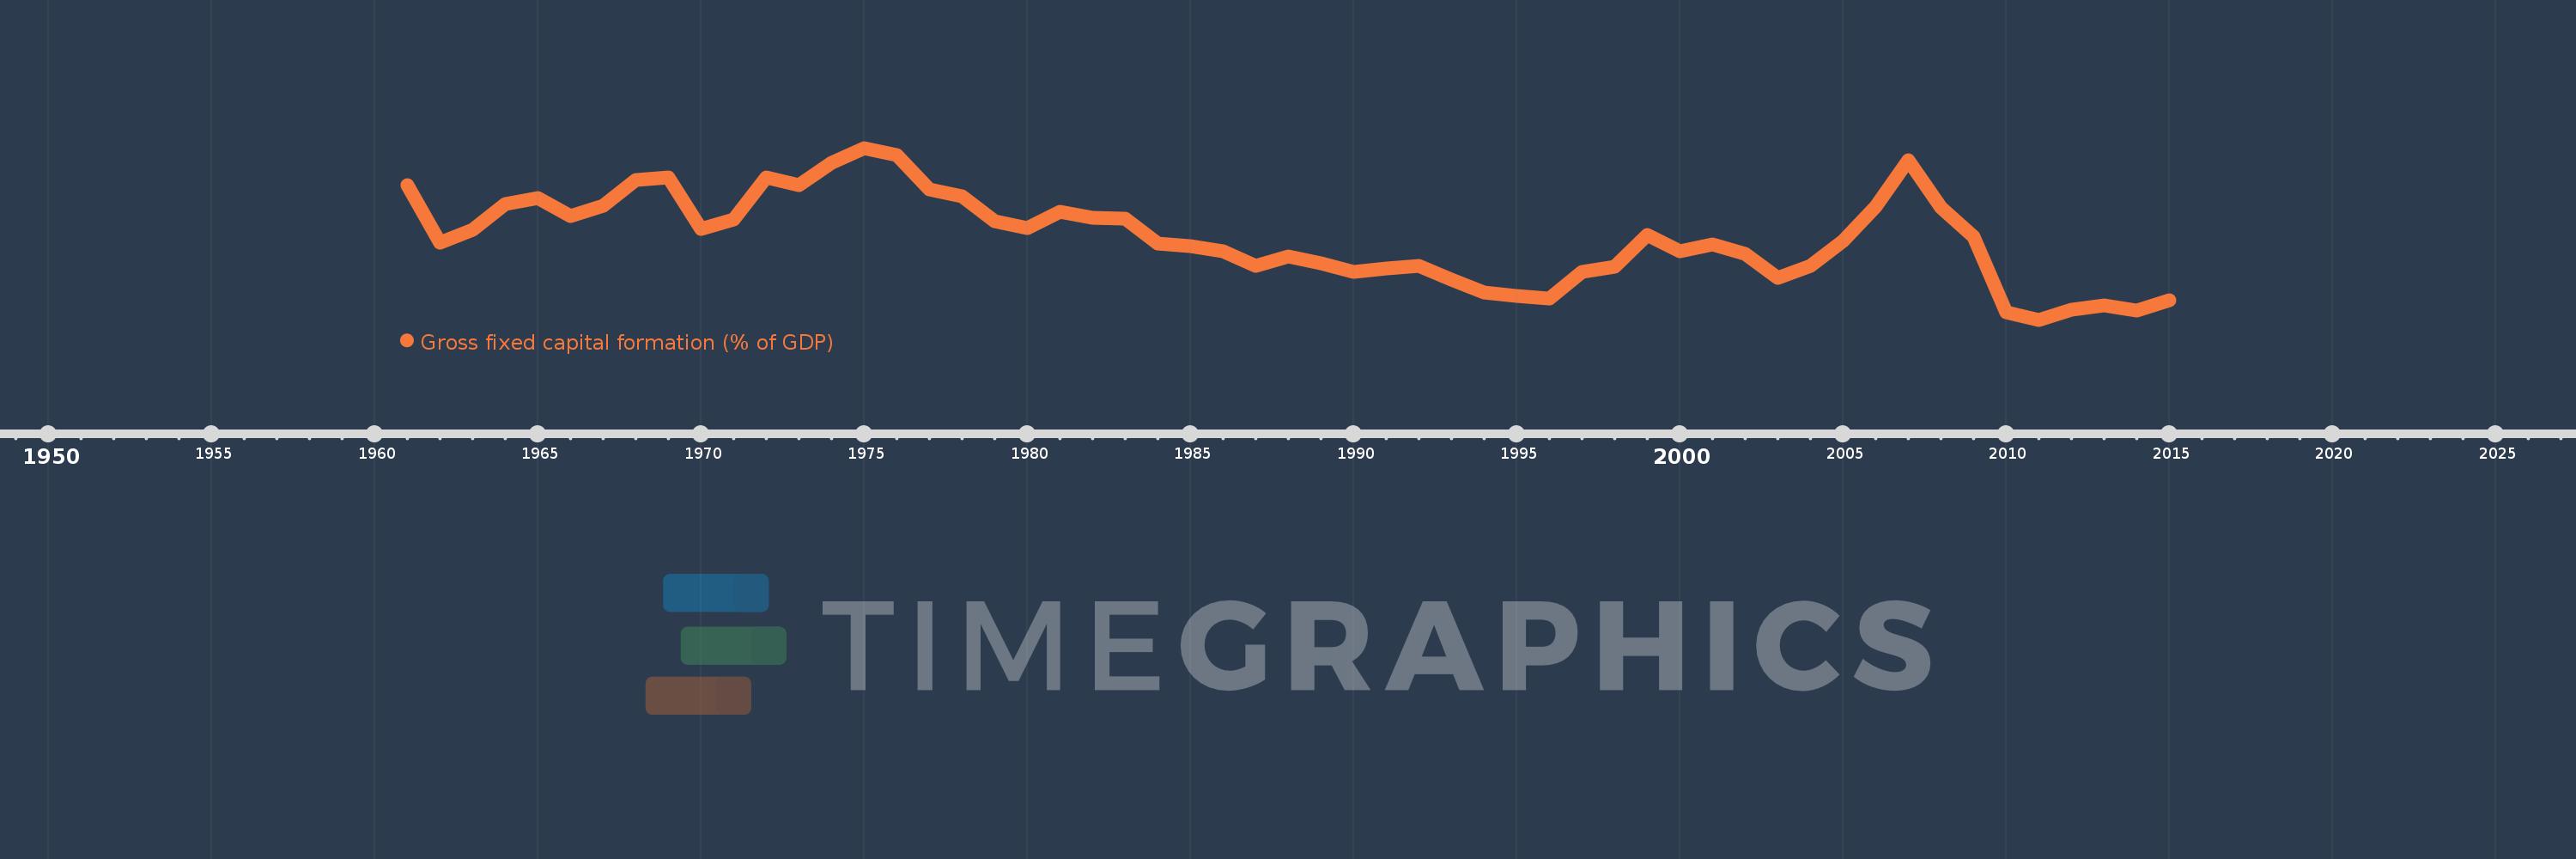
Gross fixed capital formation (% of GDP)
2015,2014,2013,2012,2011,2010,2009,2008,2007,2006,2005,2004,2003,2002,2001,2000,1999,1998,1997,1996,1995,1994,1993,1992,1991,1990,1989,1988,1987,1986,1985,1984,1983,1982,1981,1980,1979,1978,1977,1976,1975,1974,1973,1972,1971,1970,1969,1968,1967,1966,1965,1964,1963,1962,1961
Estas estadísticas en otros países:
AfghanistanAlbaniaAlgeriaAngolaAntigua and BarbudaArab WorldArgentinaArmeniaArubaAustraliaAustriaAzerbaijanBahamas, TheBahrainBangladeshBarbadosBelarusBelgiumBelizeBeninBermudaBhutanBoliviaBosnia and HerzegovinaBotswanaBrazilBrunei DarussalamBulgariaBurkina FasoBurundiCabo VerdeCambodiaCameroonCanadaCaribbean small statesCentral African RepublicCentral Europe and the BalticsChadChileChinaColombiaComorosCongo, Dem. Rep.Congo, Rep.Costa RicaCote d'IvoireCroatiaCubaCyprusCzech RepublicDenmarkDjiboutiDominicaDominican RepublicEarly-demographic dividendEast Asia & PacificEast Asia & Pacific (excluding high income)East Asia & Pacific (IDA & IBRD countries)EcuadorEgypt, Arab Rep.El SalvadorEquatorial GuineaEritreaEstoniaEthiopiaEuro areaEurope & Central AsiaEurope & Central Asia (excluding high income)Europe & Central Asia (IDA & IBRD countries)European UnionFijiFinlandFragile and conflict affected situationsFranceGabonGambia, TheGeorgiaGermanyGhanaGreeceGrenadaGuatemalaGuineaGuinea-BissauGuyanaHaitiHeavily indebted poor countries (HIPC)High incomeHondurasHong Kong SAR, ChinaHungaryIBRD onlyIcelandIDA & IBRD totalIDA blendIDA onlyIDA totalIndiaIndonesiaIran, Islamic Rep.IraqIrelandIsraelItalyJamaicaJapanJordanKazakhstanKenyaKiribatiKorea, Rep.KosovoKuwaitKyrgyz RepublicLao PDRLate-demographic dividendLatin America & Caribbean Latin America & Caribbean (excluding high income)Latin America & the Caribbean (IDA & IBRD countries)LatviaLeast developed countries: UN classificationLebanonLesothoLiberiaLibyaLithuaniaLow & middle incomeLow incomeLower middle incomeLuxembourgMacao SAR, ChinaMacedonia, FYRMadagascarMalawiMalaysiaMaldivesMaliMaltaMauritaniaMauritiusMexicoMicronesia, Fed. Sts.Middle East & North AfricaMiddle East & North Africa (excluding high income)Middle East & North Africa (IDA & IBRD countries)Middle incomeMoldovaMongoliaMontenegroMoroccoMozambiqueNamibiaNepalNetherlandsNew CaledoniaNew ZealandNicaraguaNigerNigeriaNorth AmericaNorwayOECD membersOmanPacific island small statesPakistanPanamaPapua New GuineaParaguayPeruPhilippinesPolandPortugalPost-demographic dividendPre-demographic dividendPuerto RicoRomaniaRussian FederationRwandaSaudi ArabiaSenegalSerbiaSeychellesSierra LeoneSingaporeSlovak RepublicSloveniaSolomon IslandsSomaliaSouth AfricaSouth AsiaSouth Asia (IDA & IBRD)South SudanSpainSri LankaSt. Kitts and NevisSt. LuciaSt. Vincent and the GrenadinesSub-Saharan Africa Sub-Saharan Africa (excluding high income)Sub-Saharan Africa (IDA & IBRD countries)SudanSurinameSwazilandSwedenSwitzerlandSyrian Arab RepublicTajikistanTanzaniaThailandTimor-LesteTogoTongaTrinidad and TobagoTunisiaTurkeyTurkmenistanUgandaUkraineUnited Arab EmiratesUnited KingdomUnited StatesUpper middle incomeUruguayUzbekistanVanuatuVenezuela, RBVietnamWest Bank and GazaWorldYemen, Rep.ZambiaZimbabwe línea de tiempo (timeline):
En esta escala de tiempo se presenta un gráfico de 1961 y 2015 de Iceland. Los datos de 1960 están ausentes. El número de observaciones reales por fecha: 55.
Fuente (nombre):
Indicadores del desarrollo mundial
Fuente (organización):
World Bank national accounts data, and OECD National Accounts data files.
Categorías:
Economy & Growth
Se ha actualizado:
23 abr 2017 año
Los indicadores de los cambios de valor en los últimos años
Mínimo:
14.014
1 ene 2011 año
Máximo:
37.409
1 ene 1975 año
A la fecha de observación
Valor
Cambio absoluto
El cambio con respecto al valor anterior
1 ene 1961 año
32.321
+32.321
0.0%
1 ene 1962 año
24.476
-7.845
-24.27%
1 ene 1963 año
26.261
+1.785
7.29%
1 ene 1964 año
29.809
+3.549
13.51%
1 ene 1965 año
30.568
+0.759
2.54%
1 ene 1966 año
28.152
-2.416
-7.9%
1 ene 1967 año
29.542
+1.39
4.94%
1 ene 1968 año
33.061
+3.519
11.91%
1 ene 1969 año
33.345
+0.283
0.86%
1 ene 1970 año
26.353
-6.991
-20.97%
1 ene 1971 año
27.717
+1.364
5.18%
1 ene 1972 año
33.414
+5.697
20.55%
1 ene 1973 año
32.377
-1.037
-3.1%
1 ene 1974 año
35.348
+2.971
9.18%
1 ene 1975 año
37.409
+2.061
5.83%
1 ene 1976 año
36.421
-0.988
-2.64%
1 ene 1977 año
31.781
-4.64
-12.74%
1 ene 1978 año
30.77
-1.011
-3.18%
1 ene 1979 año
27.456
-3.314
-10.77%
1 ene 1980 año
26.532
-0.924
-3.36%
1 ene 1981 año
28.696
+2.163
8.15%
1 ene 1982 año
27.855
-0.84
-2.93%
1 ene 1983 año
27.777
-0.079
-0.28%
1 ene 1984 año
24.426
-3.351
-12.06%
1 ene 1985 año
24.092
-0.334
-1.37%
1 ene 1986 año
23.312
-0.78
-3.24%
1 ene 1987 año
21.32
-1.992
-8.55%
1 ene 1988 año
22.588
+1.269
5.95%
1 ene 1989 año
21.745
-0.844
-3.74%
1 ene 1990 año
20.519
-1.226
-5.64%
1 ene 1991 año
21.031
+0.513
2.5%
1 ene 1992 año
21.316
+0.285
1.35%
1 ene 1993 año
19.533
-1.783
-8.37%
1 ene 1994 año
17.674
-1.858
-9.51%
1 ene 1995 año
17.234
-0.441
-2.49%
1 ene 1996 año
16.935
-0.299
-1.74%
1 ene 1997 año
20.474
+3.539
20.9%
1 ene 1998 año
21.257
+0.783
3.83%
1 ene 1999 año
25.511
+4.254
20.01%
1 ene 2000 año
23.302
-2.209
-8.66%
1 ene 2001 año
24.228
+0.926
3.97%
1 ene 2002 año
23.042
-1.186
-4.9%
1 ene 2003 año
19.711
-3.331
-14.45%
1 ene 2004 año
21.333
+1.621
8.22%
1 ene 2005 año
24.766
+3.433
16.09%
1 ene 2006 año
29.419
+4.653
18.79%
1 ene 2007 año
35.687
+6.268
21.31%
1 ene 2008 año
29.348
-6.34
-17.76%
1 ene 2009 año
25.383
-3.965
-13.51%
1 ene 2010 año
15.025
-10.358
-40.81%
1 ene 2011 año
14.014
-1.011
-6.73%
1 ene 2012 año
15.384
+1.371
9.78%
1 ene 2013 año
16.025
+0.64
4.16%
1 ene 2014 año
15.305
-0.72
-4.49%
1 ene 2015 año
16.688
+1.384
9.04%
Ranking de los países por los datos estadísticos actuales


Comentarios: