29
/es/
es
AIzaSyAYiBZKx7MnpbEhh9jyipgxe19OcubqV5w
April 1, 2024
234695
Saudi Arabia
SAU
true
2
1
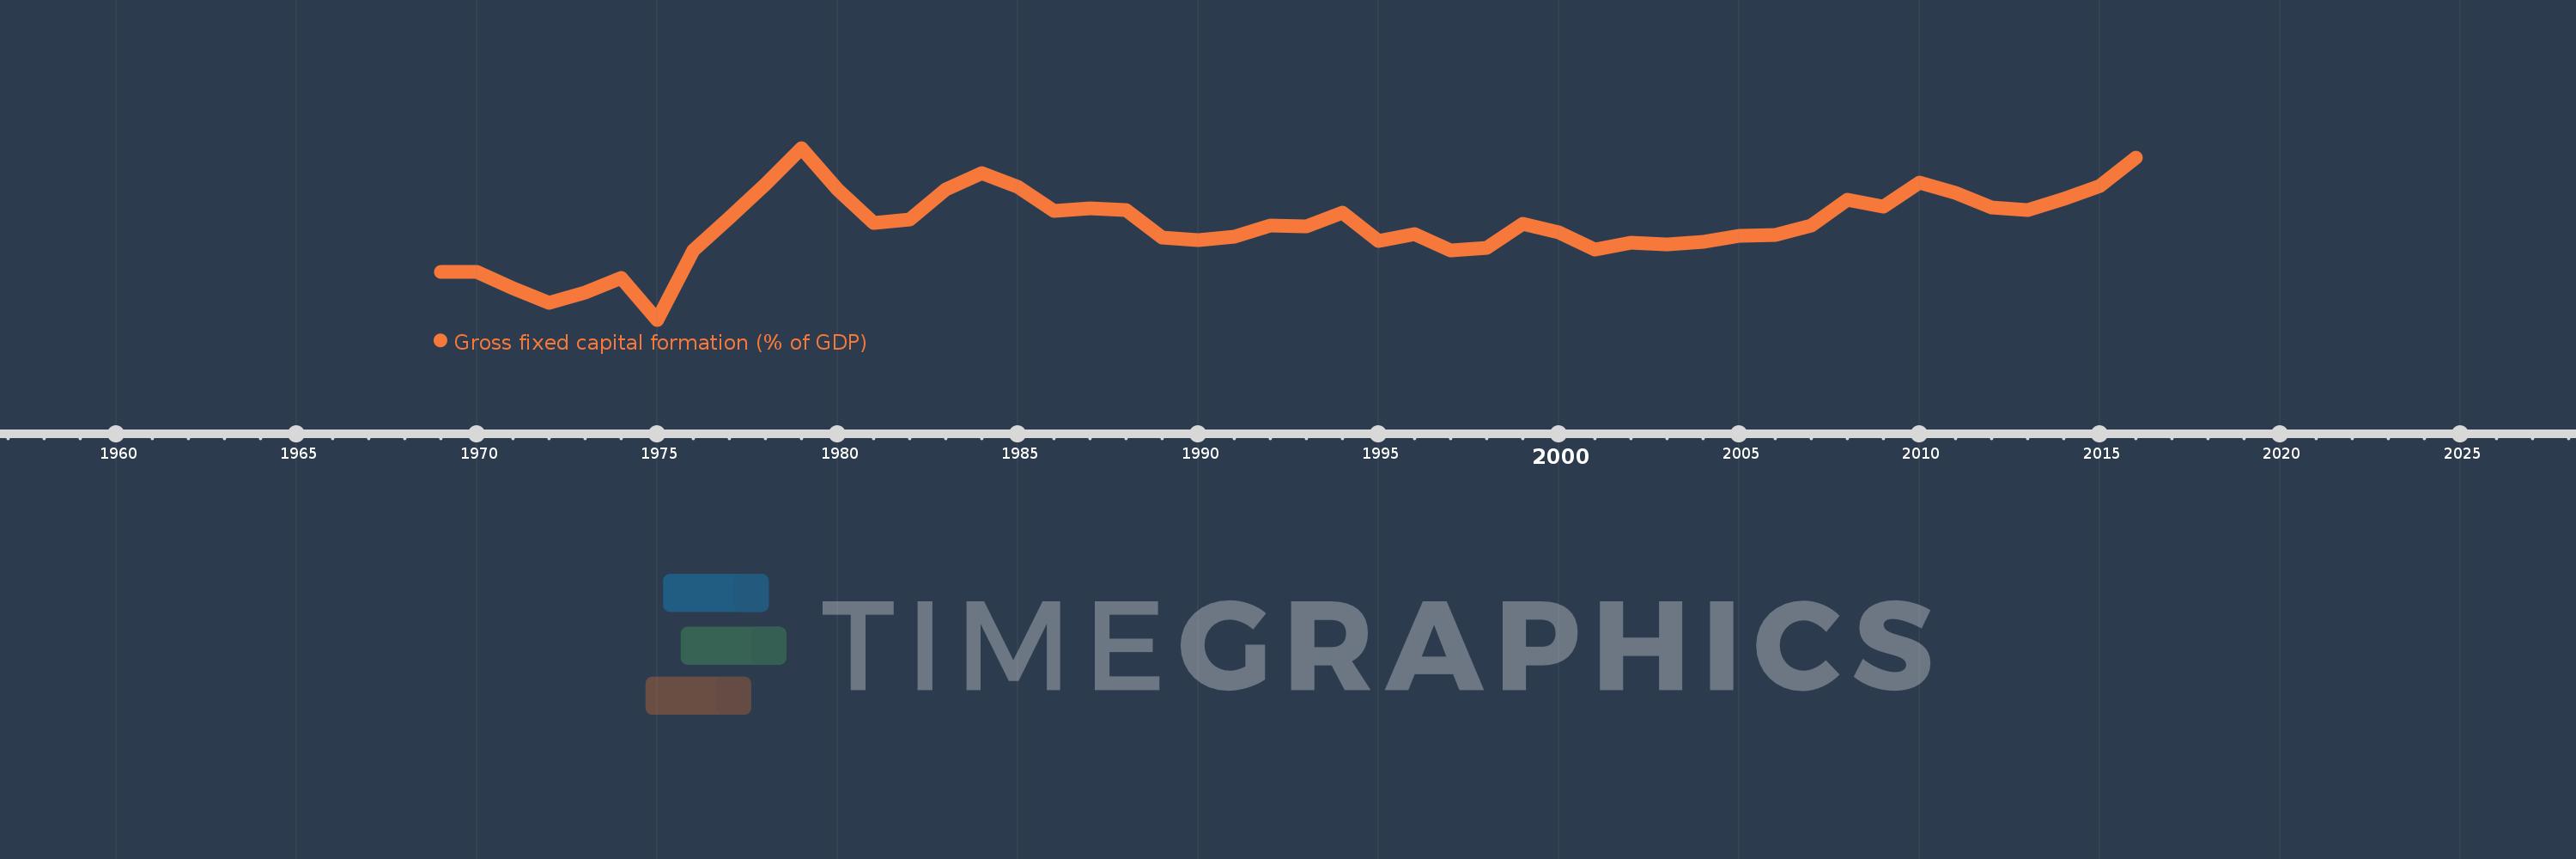
Gross fixed capital formation (% of GDP)
2016,2015,2014,2013,2012,2011,2010,2009,2008,2007,2006,2005,2004,2003,2002,2001,2000,1999,1998,1997,1996,1995,1994,1993,1992,1991,1990,1989,1988,1987,1986,1985,1984,1983,1982,1981,1980,1979,1978,1977,1976,1975,1974,1973,1972,1971,1970,1969
Estas estadísticas en otros países:
AfghanistanAlbaniaAlgeriaAngolaAntigua and BarbudaArab WorldArgentinaArmeniaArubaAustraliaAustriaAzerbaijanBahamas, TheBahrainBangladeshBarbadosBelarusBelgiumBelizeBeninBermudaBhutanBoliviaBosnia and HerzegovinaBotswanaBrazilBrunei DarussalamBulgariaBurkina FasoBurundiCabo VerdeCambodiaCameroonCanadaCaribbean small statesCentral African RepublicCentral Europe and the BalticsChadChileChinaColombiaComorosCongo, Dem. Rep.Congo, Rep.Costa RicaCote d'IvoireCroatiaCubaCyprusCzech RepublicDenmarkDjiboutiDominicaDominican RepublicEarly-demographic dividendEast Asia & PacificEast Asia & Pacific (excluding high income)East Asia & Pacific (IDA & IBRD countries)EcuadorEgypt, Arab Rep.El SalvadorEquatorial GuineaEritreaEstoniaEthiopiaEuro areaEurope & Central AsiaEurope & Central Asia (excluding high income)Europe & Central Asia (IDA & IBRD countries)European UnionFijiFinlandFragile and conflict affected situationsFranceGabonGambia, TheGeorgiaGermanyGhanaGreeceGrenadaGuatemalaGuineaGuinea-BissauGuyanaHaitiHeavily indebted poor countries (HIPC)High incomeHondurasHong Kong SAR, ChinaHungaryIBRD onlyIcelandIDA & IBRD totalIDA blendIDA onlyIDA totalIndiaIndonesiaIran, Islamic Rep.IraqIrelandIsraelItalyJamaicaJapanJordanKazakhstanKenyaKiribatiKorea, Rep.KosovoKuwaitKyrgyz RepublicLao PDRLate-demographic dividendLatin America & Caribbean Latin America & Caribbean (excluding high income)Latin America & the Caribbean (IDA & IBRD countries)LatviaLeast developed countries: UN classificationLebanonLesothoLiberiaLibyaLithuaniaLow & middle incomeLow incomeLower middle incomeLuxembourgMacao SAR, ChinaMacedonia, FYRMadagascarMalawiMalaysiaMaldivesMaliMaltaMauritaniaMauritiusMexicoMicronesia, Fed. Sts.Middle East & North AfricaMiddle East & North Africa (excluding high income)Middle East & North Africa (IDA & IBRD countries)Middle incomeMoldovaMongoliaMontenegroMoroccoMozambiqueNamibiaNepalNetherlandsNew CaledoniaNew ZealandNicaraguaNigerNigeriaNorth AmericaNorwayOECD membersOmanPacific island small statesPakistanPanamaPapua New GuineaParaguayPeruPhilippinesPolandPortugalPost-demographic dividendPre-demographic dividendPuerto RicoRomaniaRussian FederationRwandaSaudi ArabiaSenegalSerbiaSeychellesSierra LeoneSingaporeSlovak RepublicSloveniaSolomon IslandsSomaliaSouth AfricaSouth AsiaSouth Asia (IDA & IBRD)South SudanSpainSri LankaSt. Kitts and NevisSt. LuciaSt. Vincent and the GrenadinesSub-Saharan Africa Sub-Saharan Africa (excluding high income)Sub-Saharan Africa (IDA & IBRD countries)SudanSurinameSwazilandSwedenSwitzerlandSyrian Arab RepublicTajikistanTanzaniaThailandTimor-LesteTogoTongaTrinidad and TobagoTunisiaTurkeyTurkmenistanUgandaUkraineUnited Arab EmiratesUnited KingdomUnited StatesUpper middle incomeUruguayUzbekistanVanuatuVenezuela, RBVietnamWest Bank and GazaWorldYemen, Rep.ZambiaZimbabwe línea de tiempo (timeline):
En esta escala de tiempo se presenta un gráfico de 1969 y 2016 de Saudi Arabia. Los datos de 1968 están ausentes. El número de observaciones reales por fecha: 48.
Fuente (nombre):
Indicadores del desarrollo mundial
Fuente (organización):
World Bank national accounts data, and OECD National Accounts data files.
Categorías:
Economy & Growth
Se ha actualizado:
23 abr 2017 año
Los indicadores de los cambios de valor en los últimos años
Mínimo:
8.834
1 ene 1975 año
Máximo:
29.991
1 ene 1979 año
A la fecha de observación
Valor
Cambio absoluto
El cambio con respecto al valor anterior
1 ene 1969 año
14.777
+14.777
0.0%
1 ene 1970 año
14.687
-0.091
-0.62%
1 ene 1971 año
12.683
-2.004
-13.64%
1 ene 1972 año
10.904
-1.779
-14.03%
1 ene 1973 año
12.213
+1.309
12.01%
1 ene 1974 año
13.979
+1.766
14.46%
1 ene 1975 año
8.834
-5.145
-36.81%
1 ene 1976 año
17.393
+8.559
96.89%
1 ene 1977 año
21.403
+4.01
23.05%
1 ene 1978 año
25.53
+4.127
19.28%
1 ene 1979 año
29.991
+4.46
17.47%
1 ene 1980 año
24.919
-5.072
-16.91%
1 ene 1981 año
20.724
-4.195
-16.84%
1 ene 1982 año
21.217
+0.494
2.38%
1 ene 1983 año
24.892
+3.675
17.32%
1 ene 1984 año
26.942
+2.05
8.23%
1 ene 1985 año
25.157
-1.785
-6.63%
1 ene 1986 año
22.288
-2.869
-11.4%
1 ene 1987 año
22.575
+0.287
1.29%
1 ene 1988 año
22.329
-0.246
-1.09%
1 ene 1989 año
18.927
-3.402
-15.24%
1 ene 1990 año
18.594
-0.333
-1.76%
1 ene 1991 año
19.036
+0.442
2.38%
1 ene 1992 año
20.429
+1.393
7.32%
1 ene 1993 año
20.365
-0.064
-0.31%
1 ene 1994 año
21.989
+1.624
7.97%
1 ene 1995 año
18.487
-3.501
-15.92%
1 ene 1996 año
19.366
+0.878
4.75%
1 ene 1997 año
17.41
-1.956
-10.1%
1 ene 1998 año
17.679
+0.27
1.55%
1 ene 1999 año
20.664
+2.985
16.88%
1 ene 2000 año
19.582
-1.082
-5.23%
1 ene 2001 año
17.452
-2.13
-10.88%
1 ene 2002 año
18.373
+0.922
5.28%
1 ene 2003 año
18.112
-0.261
-1.42%
1 ene 2004 año
18.405
+0.293
1.62%
1 ene 2005 año
19.156
+0.751
4.08%
1 ene 2006 año
19.312
+0.156
0.81%
1 ene 2007 año
20.452
+1.14
5.9%
1 ene 2008 año
23.652
+3.199
15.64%
1 ene 2009 año
22.804
-0.848
-3.58%
1 ene 2010 año
25.756
+2.953
12.95%
1 ene 2011 año
24.496
-1.261
-4.9%
1 ene 2012 año
22.655
-1.84
-7.51%
1 ene 2013 año
22.341
-0.314
-1.39%
1 ene 2014 año
23.733
+1.392
6.23%
1 ene 2015 año
25.267
+1.533
6.46%
1 ene 2016 año
28.794
+3.527
13.96%
Ranking de los países por los datos estadísticos actuales


Comentarios: