29
/es/
es
AIzaSyAYiBZKx7MnpbEhh9jyipgxe19OcubqV5w
April 1, 2024
191461
Malta
MLT
true
2
1
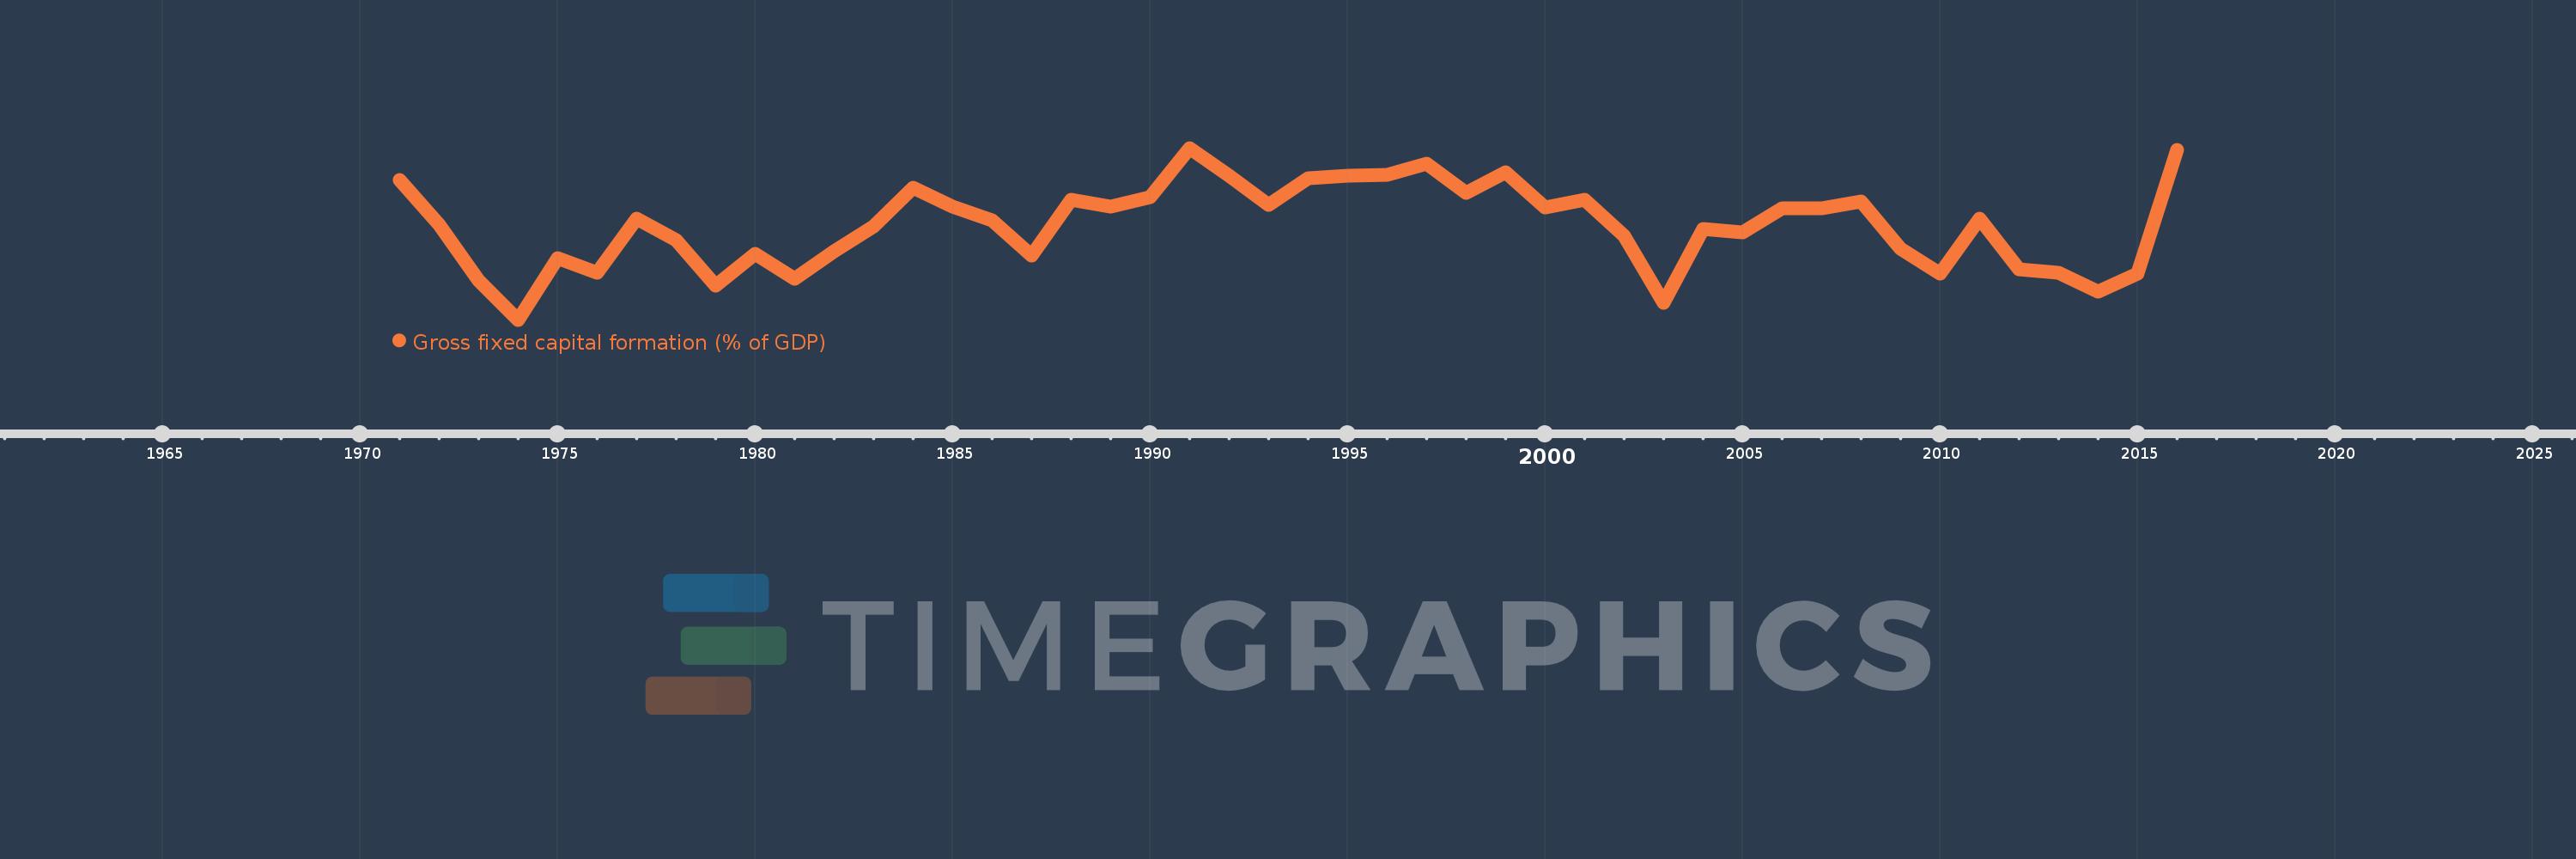
Gross fixed capital formation (% of GDP)
2016,2015,2014,2013,2012,2011,2010,2009,2008,2007,2006,2005,2004,2003,2002,2001,2000,1999,1998,1997,1996,1995,1994,1993,1992,1991,1990,1989,1988,1987,1986,1985,1984,1983,1982,1981,1980,1979,1978,1977,1976,1975,1974,1973,1972,1971
Estas estadísticas en otros países:
AfghanistanAlbaniaAlgeriaAngolaAntigua and BarbudaArab WorldArgentinaArmeniaArubaAustraliaAustriaAzerbaijanBahamas, TheBahrainBangladeshBarbadosBelarusBelgiumBelizeBeninBermudaBhutanBoliviaBosnia and HerzegovinaBotswanaBrazilBrunei DarussalamBulgariaBurkina FasoBurundiCabo VerdeCambodiaCameroonCanadaCaribbean small statesCentral African RepublicCentral Europe and the BalticsChadChileChinaColombiaComorosCongo, Dem. Rep.Congo, Rep.Costa RicaCote d'IvoireCroatiaCubaCyprusCzech RepublicDenmarkDjiboutiDominicaDominican RepublicEarly-demographic dividendEast Asia & PacificEast Asia & Pacific (excluding high income)East Asia & Pacific (IDA & IBRD countries)EcuadorEgypt, Arab Rep.El SalvadorEquatorial GuineaEritreaEstoniaEthiopiaEuro areaEurope & Central AsiaEurope & Central Asia (excluding high income)Europe & Central Asia (IDA & IBRD countries)European UnionFijiFinlandFragile and conflict affected situationsFranceGabonGambia, TheGeorgiaGermanyGhanaGreeceGrenadaGuatemalaGuineaGuinea-BissauGuyanaHaitiHeavily indebted poor countries (HIPC)High incomeHondurasHong Kong SAR, ChinaHungaryIBRD onlyIcelandIDA & IBRD totalIDA blendIDA onlyIDA totalIndiaIndonesiaIran, Islamic Rep.IraqIrelandIsraelItalyJamaicaJapanJordanKazakhstanKenyaKiribatiKorea, Rep.KosovoKuwaitKyrgyz RepublicLao PDRLate-demographic dividendLatin America & Caribbean Latin America & Caribbean (excluding high income)Latin America & the Caribbean (IDA & IBRD countries)LatviaLeast developed countries: UN classificationLebanonLesothoLiberiaLibyaLithuaniaLow & middle incomeLow incomeLower middle incomeLuxembourgMacao SAR, ChinaMacedonia, FYRMadagascarMalawiMalaysiaMaldivesMaliMaltaMauritaniaMauritiusMexicoMicronesia, Fed. Sts.Middle East & North AfricaMiddle East & North Africa (excluding high income)Middle East & North Africa (IDA & IBRD countries)Middle incomeMoldovaMongoliaMontenegroMoroccoMozambiqueNamibiaNepalNetherlandsNew CaledoniaNew ZealandNicaraguaNigerNigeriaNorth AmericaNorwayOECD membersOmanPacific island small statesPakistanPanamaPapua New GuineaParaguayPeruPhilippinesPolandPortugalPost-demographic dividendPre-demographic dividendPuerto RicoRomaniaRussian FederationRwandaSaudi ArabiaSenegalSerbiaSeychellesSierra LeoneSingaporeSlovak RepublicSloveniaSolomon IslandsSomaliaSouth AfricaSouth AsiaSouth Asia (IDA & IBRD)South SudanSpainSri LankaSt. Kitts and NevisSt. LuciaSt. Vincent and the GrenadinesSub-Saharan Africa Sub-Saharan Africa (excluding high income)Sub-Saharan Africa (IDA & IBRD countries)SudanSurinameSwazilandSwedenSwitzerlandSyrian Arab RepublicTajikistanTanzaniaThailandTimor-LesteTogoTongaTrinidad and TobagoTunisiaTurkeyTurkmenistanUgandaUkraineUnited Arab EmiratesUnited KingdomUnited StatesUpper middle incomeUruguayUzbekistanVanuatuVenezuela, RBVietnamWest Bank and GazaWorldYemen, Rep.ZambiaZimbabwe línea de tiempo (timeline):
En esta escala de tiempo se presenta un gráfico de 1971 y 2016 de Malta. Los datos de 1970 están ausentes. El número de observaciones reales por fecha: 46.
Fuente (nombre):
Indicadores del desarrollo mundial
Fuente (organización):
World Bank national accounts data, and OECD National Accounts data files.
Categorías:
Economy & Growth
Se ha actualizado:
23 abr 2017 año
Los indicadores de los cambios de valor en los últimos años
Mínimo:
15.488
1 ene 1974 año
Máximo:
25.494
1 ene 1991 año
A la fecha de observación
Valor
Cambio absoluto
El cambio con respecto al valor anterior
1 ene 1971 año
23.62
+23.62
0.0%
1 ene 1972 año
21.022
-2.599
-11.0%
1 ene 1973 año
17.754
-3.268
-15.55%
1 ene 1974 año
15.488
-2.266
-12.76%
1 ene 1975 año
19.092
+3.604
23.27%
1 ene 1976 año
18.209
-0.882
-4.62%
1 ene 1977 año
21.374
+3.164
17.38%
1 ene 1978 año
20.148
-1.225
-5.73%
1 ene 1979 año
17.495
-2.653
-13.17%
1 ene 1980 año
19.329
+1.834
10.48%
1 ene 1981 año
17.889
-1.44
-7.45%
1 ene 1982 año
19.483
+1.594
8.91%
1 ene 1983 año
20.947
+1.464
7.51%
1 ene 1984 año
23.166
+2.219
10.59%
1 ene 1985 año
22.086
-1.08
-4.66%
1 ene 1986 año
21.295
-0.791
-3.58%
1 ene 1987 año
19.245
-2.051
-9.63%
1 ene 1988 año
22.502
+3.257
16.92%
1 ene 1989 año
22.096
-0.405
-1.8%
1 ene 1990 año
22.644
+0.548
2.48%
1 ene 1991 año
25.494
+2.85
12.59%
1 ene 1992 año
23.867
-1.627
-6.38%
1 ene 1993 año
22.174
-1.693
-7.09%
1 ene 1994 año
23.712
+1.538
6.94%
1 ene 1995 año
23.88
+0.167
0.71%
1 ene 1996 año
23.945
+0.065
0.27%
1 ene 1997 año
24.573
+0.628
2.62%
1 ene 1998 año
22.891
-1.682
-6.85%
1 ene 1999 año
24.095
+1.205
5.26%
1 ene 2000 año
22.023
-2.072
-8.6%
1 ene 2001 año
22.494
+0.471
2.14%
1 ene 2002 año
20.394
-2.101
-9.34%
1 ene 2003 año
16.472
-3.922
-19.23%
1 ene 2004 año
20.781
+4.31
26.16%
1 ene 2005 año
20.599
-0.182
-0.88%
1 ene 2006 año
22.001
+1.402
6.8%
1 ene 2007 año
21.968
-0.033
-0.15%
1 ene 2008 año
22.374
+0.407
1.85%
1 ene 2009 año
19.631
-2.744
-12.26%
1 ene 2010 año
18.16
-1.47
-7.49%
1 ene 2011 año
21.389
+3.229
17.78%
1 ene 2012 año
18.422
-2.967
-13.87%
1 ene 2013 año
18.242
-0.18
-0.98%
1 ene 2014 año
17.143
-1.098
-6.02%
1 ene 2015 año
18.165
+1.022
5.96%
1 ene 2016 año
25.377
+7.211
39.7%
Ranking de los países por los datos estadísticos actuales


Comentarios: