29
/es/
es
AIzaSyAYiBZKx7MnpbEhh9jyipgxe19OcubqV5w
April 1, 2024
231101
Rwanda
RWA
true
2
1
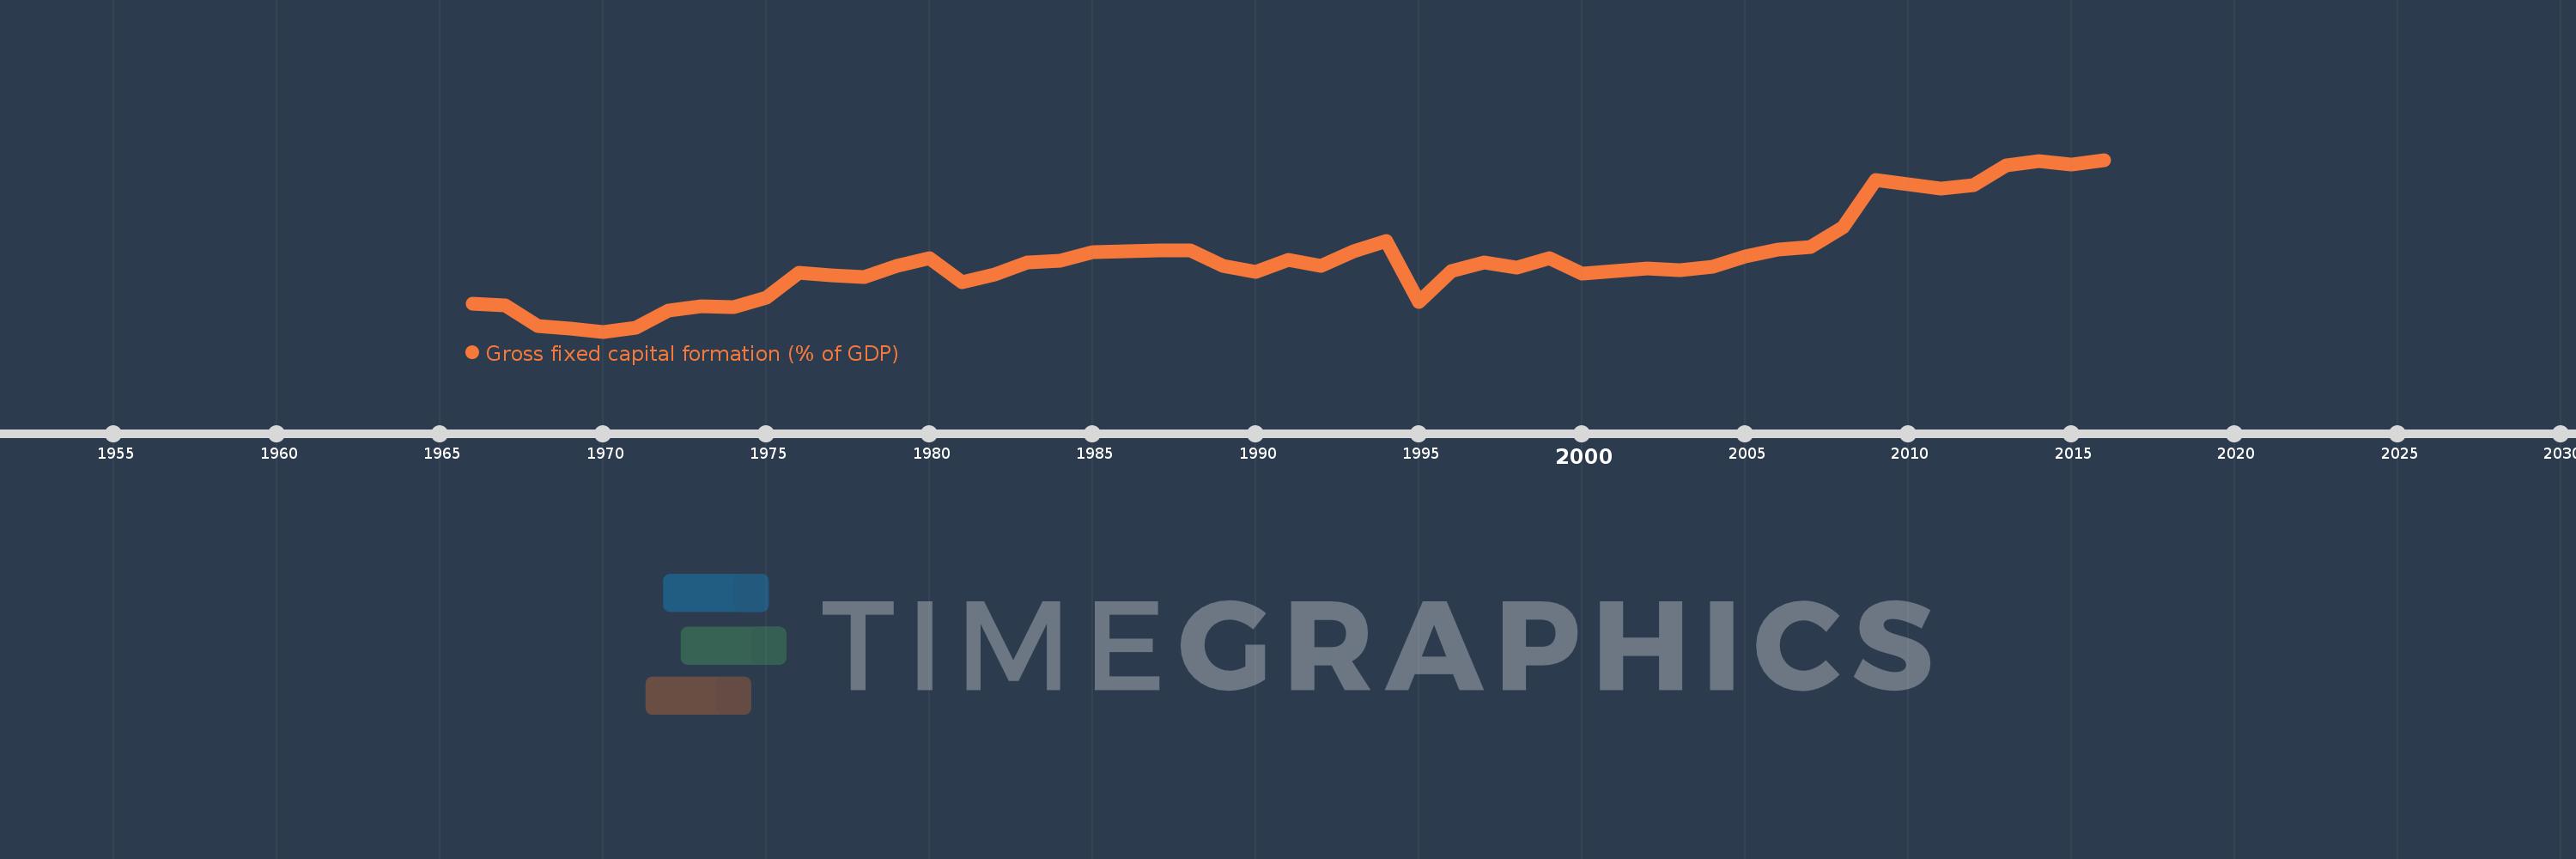
Gross fixed capital formation (% of GDP)
2016,2015,2014,2013,2012,2011,2010,2009,2008,2007,2006,2005,2004,2003,2002,2001,2000,1999,1998,1997,1996,1995,1994,1993,1992,1991,1990,1989,1988,1987,1986,1985,1984,1983,1982,1981,1980,1979,1978,1977,1976,1975,1974,1973,1972,1971,1970,1969,1968,1967,1966
Estas estadísticas en otros países:
AfghanistanAlbaniaAlgeriaAngolaAntigua and BarbudaArab WorldArgentinaArmeniaArubaAustraliaAustriaAzerbaijanBahamas, TheBahrainBangladeshBarbadosBelarusBelgiumBelizeBeninBermudaBhutanBoliviaBosnia and HerzegovinaBotswanaBrazilBrunei DarussalamBulgariaBurkina FasoBurundiCabo VerdeCambodiaCameroonCanadaCaribbean small statesCentral African RepublicCentral Europe and the BalticsChadChileChinaColombiaComorosCongo, Dem. Rep.Congo, Rep.Costa RicaCote d'IvoireCroatiaCubaCyprusCzech RepublicDenmarkDjiboutiDominicaDominican RepublicEarly-demographic dividendEast Asia & PacificEast Asia & Pacific (excluding high income)East Asia & Pacific (IDA & IBRD countries)EcuadorEgypt, Arab Rep.El SalvadorEquatorial GuineaEritreaEstoniaEthiopiaEuro areaEurope & Central AsiaEurope & Central Asia (excluding high income)Europe & Central Asia (IDA & IBRD countries)European UnionFijiFinlandFragile and conflict affected situationsFranceGabonGambia, TheGeorgiaGermanyGhanaGreeceGrenadaGuatemalaGuineaGuinea-BissauGuyanaHaitiHeavily indebted poor countries (HIPC)High incomeHondurasHong Kong SAR, ChinaHungaryIBRD onlyIcelandIDA & IBRD totalIDA blendIDA onlyIDA totalIndiaIndonesiaIran, Islamic Rep.IraqIrelandIsraelItalyJamaicaJapanJordanKazakhstanKenyaKiribatiKorea, Rep.KosovoKuwaitKyrgyz RepublicLao PDRLate-demographic dividendLatin America & Caribbean Latin America & Caribbean (excluding high income)Latin America & the Caribbean (IDA & IBRD countries)LatviaLeast developed countries: UN classificationLebanonLesothoLiberiaLibyaLithuaniaLow & middle incomeLow incomeLower middle incomeLuxembourgMacao SAR, ChinaMacedonia, FYRMadagascarMalawiMalaysiaMaldivesMaliMaltaMauritaniaMauritiusMexicoMicronesia, Fed. Sts.Middle East & North AfricaMiddle East & North Africa (excluding high income)Middle East & North Africa (IDA & IBRD countries)Middle incomeMoldovaMongoliaMontenegroMoroccoMozambiqueNamibiaNepalNetherlandsNew CaledoniaNew ZealandNicaraguaNigerNigeriaNorth AmericaNorwayOECD membersOmanPacific island small statesPakistanPanamaPapua New GuineaParaguayPeruPhilippinesPolandPortugalPost-demographic dividendPre-demographic dividendPuerto RicoRomaniaRussian FederationRwandaSaudi ArabiaSenegalSerbiaSeychellesSierra LeoneSingaporeSlovak RepublicSloveniaSolomon IslandsSomaliaSouth AfricaSouth AsiaSouth Asia (IDA & IBRD)South SudanSpainSri LankaSt. Kitts and NevisSt. LuciaSt. Vincent and the GrenadinesSub-Saharan Africa Sub-Saharan Africa (excluding high income)Sub-Saharan Africa (IDA & IBRD countries)SudanSurinameSwazilandSwedenSwitzerlandSyrian Arab RepublicTajikistanTanzaniaThailandTimor-LesteTogoTongaTrinidad and TobagoTunisiaTurkeyTurkmenistanUgandaUkraineUnited Arab EmiratesUnited KingdomUnited StatesUpper middle incomeUruguayUzbekistanVanuatuVenezuela, RBVietnamWest Bank and GazaWorldYemen, Rep.ZambiaZimbabwe línea de tiempo (timeline):
En esta escala de tiempo se presenta un gráfico de 1966 y 2016 de Rwanda. Los datos de 1965 están ausentes. El número de observaciones reales por fecha: 51.
Fuente (nombre):
Indicadores del desarrollo mundial
Fuente (organización):
World Bank national accounts data, and OECD National Accounts data files.
Categorías:
Economy & Growth
Se ha actualizado:
23 abr 2017 año
Los indicadores de los cambios de valor en los últimos años
Mínimo:
6.73
1 ene 1970 año
Máximo:
25.698
1 ene 2016 año
A la fecha de observación
Valor
Cambio absoluto
El cambio con respecto al valor anterior
1 ene 1966 año
9.812
+9.812
0.0%
1 ene 1967 año
9.664
-0.148
-1.51%
1 ene 1968 año
7.308
-2.357
-24.38%
1 ene 1969 año
7.085
-0.223
-3.05%
1 ene 1970 año
6.73
-0.355
-5.0%
1 ene 1971 año
7.185
+0.455
6.76%
1 ene 1972 año
9.042
+1.857
25.84%
1 ene 1973 año
9.515
+0.474
5.24%
1 ene 1974 año
9.426
-0.089
-0.94%
1 ene 1975 año
10.46
+1.034
10.97%
1 ene 1976 año
13.189
+2.729
26.09%
1 ene 1977 año
12.914
-0.275
-2.09%
1 ene 1978 año
12.76
-0.154
-1.19%
1 ene 1979 año
13.967
+1.207
9.46%
1 ene 1980 año
14.838
+0.872
6.24%
1 ene 1981 año
12.214
-2.624
-17.69%
1 ene 1982 año
13.03
+0.816
6.68%
1 ene 1983 año
14.342
+1.312
10.07%
1 ene 1984 año
14.586
+0.244
1.7%
1 ene 1985 año
15.5
+0.914
6.27%
1 ene 1986 año
15.571
+0.071
0.46%
1 ene 1987 año
15.734
+0.163
1.04%
1 ene 1988 año
15.706
-0.028
-0.18%
1 ene 1989 año
13.95
-1.756
-11.18%
1 ene 1990 año
13.352
-0.598
-4.29%
1 ene 1991 año
14.65
+1.298
9.72%
1 ene 1992 año
14.022
-0.628
-4.29%
1 ene 1993 año
15.634
+1.612
11.5%
1 ene 1994 año
16.747
+1.113
7.12%
1 ene 1995 año
9.983
-6.765
-40.39%
1 ene 1996 año
13.409
+3.427
34.33%
1 ene 1997 año
14.37
+0.961
7.17%
1 ene 1998 año
13.81
-0.561
-3.9%
1 ene 1999 año
14.808
+0.998
7.23%
1 ene 2000 año
13.149
-1.659
-11.2%
1 ene 2001 año
13.376
+0.227
1.73%
1 ene 2002 año
13.736
+0.36
2.69%
1 ene 2003 año
13.481
-0.254
-1.85%
1 ene 2004 año
13.854
+0.373
2.76%
1 ene 2005 año
15.028
+1.174
8.48%
1 ene 2006 año
15.764
+0.736
4.9%
1 ene 2007 año
16.026
+0.262
1.66%
1 ene 2008 año
18.257
+2.231
13.92%
1 ene 2009 año
23.485
+5.228
28.64%
1 ene 2010 año
22.97
-0.515
-2.19%
1 ene 2011 año
22.51
-0.46
-2.0%
1 ene 2012 año
22.855
+0.345
1.53%
1 ene 2013 año
25.051
+2.196
9.61%
1 ene 2014 año
25.535
+0.484
1.93%
1 ene 2015 año
25.19
-0.345
-1.35%
1 ene 2016 año
25.698
+0.508
2.02%
Ranking de los países por los datos estadísticos actuales


Comentarios: