29
/es/
es
AIzaSyAYiBZKx7MnpbEhh9jyipgxe19OcubqV5w
April 1, 2024
44822
Low & middle income
LMY
false
2
1
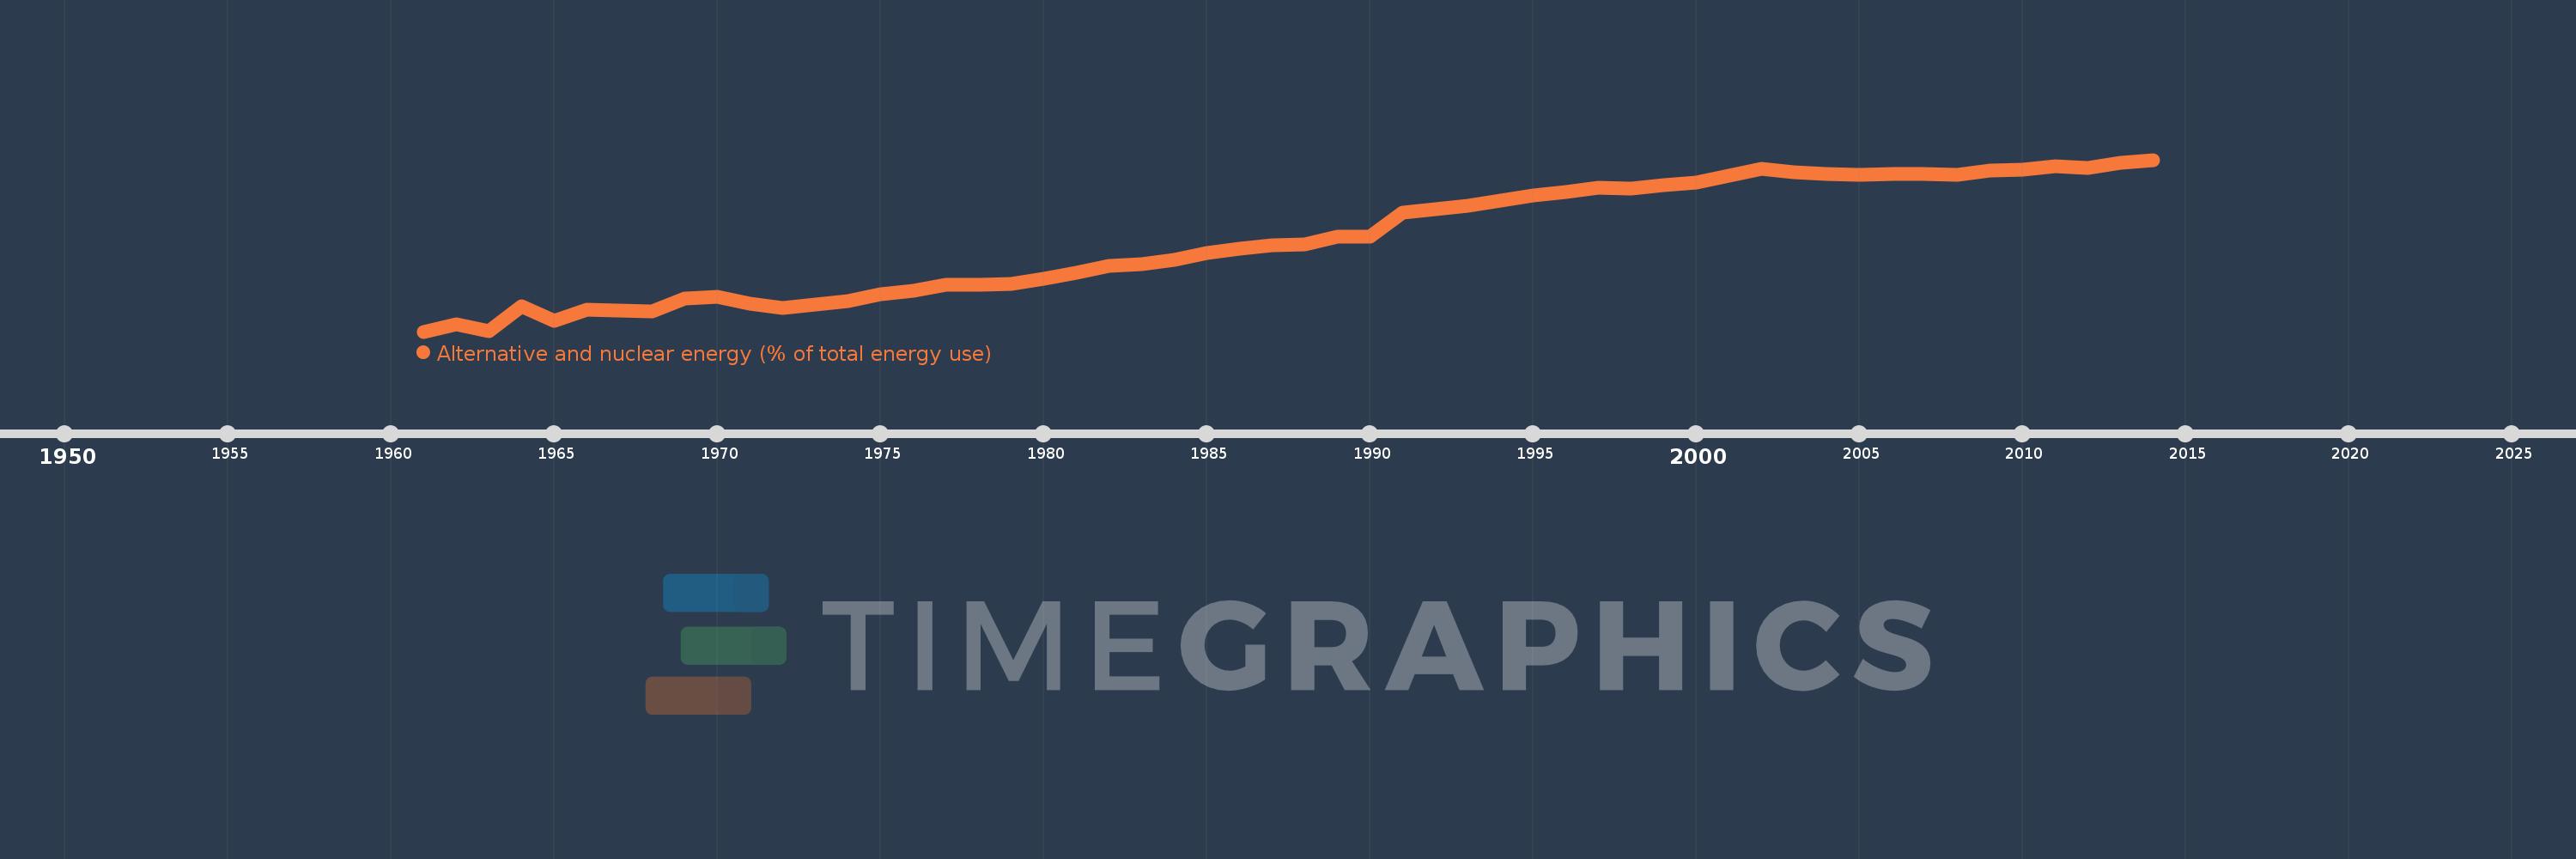
Alternative and nuclear energy (% of total energy use)
2014,2013,2012,2011,2010,2009,2008,2007,2006,2005,2004,2003,2002,2001,2000,1999,1998,1997,1996,1995,1994,1993,1992,1991,1990,1989,1988,1987,1986,1985,1984,1983,1982,1981,1980,1979,1978,1977,1976,1975,1974,1973,1972,1971,1970,1969,1968,1967,1966,1965,1964,1963,1962,1961
Estas estadísticas en otros países:
AlbaniaAlgeriaAngolaArab WorldArgentinaArmeniaAustraliaAustriaAzerbaijanBahrainBangladeshBelarusBelgiumBeninBoliviaBosnia and HerzegovinaBotswanaBrazilBrunei DarussalamBulgariaCambodiaCameroonCanadaCaribbean small statesCentral Europe and the BalticsChileChinaColombiaCongo, Dem. Rep.Congo, Rep.Costa RicaCote d'IvoireCroatiaCubaCuracaoCyprusCzech RepublicDenmarkDominican RepublicEarly-demographic dividendEast Asia & PacificEast Asia & Pacific (excluding high income)East Asia & Pacific (IDA & IBRD countries)EcuadorEgypt, Arab Rep.El SalvadorEritreaEstoniaEthiopiaEuro areaEurope & Central AsiaEurope & Central Asia (excluding high income)Europe & Central Asia (IDA & IBRD countries)European UnionFinlandFragile and conflict affected situationsFranceGabonGeorgiaGermanyGhanaGibraltarGreeceGuatemalaHaitiHeavily indebted poor countries (HIPC)High incomeHondurasHong Kong SAR, ChinaHungaryIBRD onlyIcelandIDA & IBRD totalIDA blendIDA onlyIDA totalIndiaIndonesiaIran, Islamic Rep.IraqIrelandIsraelItalyJamaicaJapanJordanKazakhstanKenyaKorea, Dem. People’s Rep.Korea, Rep.KosovoKuwaitKyrgyz RepublicLate-demographic dividendLatin America & Caribbean Latin America & Caribbean (excluding high income)Latin America & the Caribbean (IDA & IBRD countries)LatviaLeast developed countries: UN classificationLebanonLibyaLithuaniaLow & middle incomeLow incomeLower middle incomeLuxembourgMacedonia, FYRMalaysiaMaltaMauritiusMexicoMiddle East & North AfricaMiddle East & North Africa (excluding high income)Middle East & North Africa (IDA & IBRD countries)Middle incomeMoldovaMongoliaMontenegroMoroccoMozambiqueMyanmarNamibiaNepalNetherlandsNew ZealandNicaraguaNigerNigeriaNorth AmericaNorwayOECD membersOmanOther small statesPakistanPanamaParaguayPeruPhilippinesPolandPortugalPost-demographic dividendPre-demographic dividendQatarRomaniaRussian FederationSaudi ArabiaSenegalSerbiaSingaporeSlovak RepublicSloveniaSmall statesSouth AfricaSouth AsiaSouth Asia (IDA & IBRD)South SudanSpainSri LankaSub-Saharan Africa Sub-Saharan Africa (excluding high income)Sub-Saharan Africa (IDA & IBRD countries)SudanSwedenSwitzerlandSyrian Arab RepublicTajikistanTanzaniaThailandTogoTrinidad and TobagoTunisiaTurkeyTurkmenistanUkraineUnited Arab EmiratesUnited KingdomUnited StatesUpper middle incomeUruguayUzbekistanVenezuela, RBVietnamWorldYemen, Rep.ZambiaZimbabwe línea de tiempo (timeline):
En esta escala de tiempo se presenta un gráfico de 1961 y 2014 de Low & middle income. Los datos de 1960 están ausentes. El número de observaciones reales por fecha: 54.
Fuente (nombre):
Indicadores del desarrollo mundial
Fuente (organización):
IEA Statistics © OECD/IEA 2014 (http://www.iea.org/stats/index.asp), subject to https://www.iea.org/t&c/termsandconditions/
Categorías:
Energy & Mining
Se ha actualizado:
23 abr 2017 año
Los indicadores de los cambios de valor en los últimos años
Mínimo:
0.806
1 ene 1961 año
Máximo:
5.457
1 ene 2014 año
A la fecha de observación
Valor
Cambio absoluto
El cambio con respecto al valor anterior
1 ene 1961 año
0.806
+0.806
0.0%
1 ene 1962 año
1.003
+0.197
24.39%
1 ene 1963 año
0.815
-0.187
-18.67%
1 ene 1964 año
1.481
+0.665
81.57%
1 ene 1965 año
1.106
-0.375
-25.32%
1 ene 1966 año
1.409
+0.303
27.44%
1 ene 1967 año
1.373
-0.036
-2.56%
1 ene 1968 año
1.349
-0.024
-1.74%
1 ene 1969 año
1.704
+0.355
26.27%
1 ene 1970 año
1.75
+0.046
2.68%
1 ene 1971 año
1.556
-0.194
-11.07%
1 ene 1972 año
1.436
-0.12
-7.72%
1 ene 1973 año
1.534
+0.099
6.88%
1 ene 1974 año
1.634
+0.1
6.51%
1 ene 1975 año
1.806
+0.172
10.51%
1 ene 1976 año
1.913
+0.107
5.9%
1 ene 1977 año
2.062
+0.15
7.83%
1 ene 1978 año
2.067
+0.005
0.22%
1 ene 1979 año
2.098
+0.031
1.52%
1 ene 1980 año
2.243
+0.145
6.93%
1 ene 1981 año
2.388
+0.144
6.42%
1 ene 1982 año
2.576
+0.189
7.91%
1 ene 1983 año
2.639
+0.063
2.43%
1 ene 1984 año
2.754
+0.115
4.36%
1 ene 1985 año
2.939
+0.185
6.73%
1 ene 1986 año
3.053
+0.114
3.89%
1 ene 1987 año
3.132
+0.079
2.58%
1 ene 1988 año
3.164
+0.032
1.02%
1 ene 1989 año
3.38
+0.216
6.84%
1 ene 1990 año
3.382
+0.002
0.05%
1 ene 1991 año
4.024
+0.642
18.97%
1 ene 1992 año
4.116
+0.092
2.3%
1 ene 1993 año
4.204
+0.088
2.13%
1 ene 1994 año
4.354
+0.15
3.57%
1 ene 1995 año
4.491
+0.137
3.15%
1 ene 1996 año
4.58
+0.089
1.98%
1 ene 1997 año
4.698
+0.119
2.59%
1 ene 1998 año
4.687
-0.011
-0.23%
1 ene 1999 año
4.77
+0.083
1.77%
1 ene 2000 año
4.834
+0.064
1.34%
1 ene 2001 año
5.016
+0.182
3.77%
1 ene 2002 año
5.21
+0.194
3.86%
1 ene 2003 año
5.125
-0.085
-1.63%
1 ene 2004 año
5.069
-0.056
-1.09%
1 ene 2005 año
5.059
-0.01
-0.19%
1 ene 2006 año
5.073
+0.014
0.28%
1 ene 2007 año
5.068
-0.005
-0.1%
1 ene 2008 año
5.054
-0.014
-0.27%
1 ene 2009 año
5.161
+0.107
2.12%
1 ene 2010 año
5.194
+0.033
0.64%
1 ene 2011 año
5.291
+0.096
1.85%
1 ene 2012 año
5.233
-0.057
-1.09%
1 ene 2013 año
5.378
+0.144
2.76%
1 ene 2014 año
5.457
+0.079
1.47%
Ranking de los países por los datos estadísticos actuales


Comentarios: