29
/es/
es
AIzaSyAYiBZKx7MnpbEhh9jyipgxe19OcubqV5w
April 1, 2024
162200
Jamaica
JAM
true
2
1
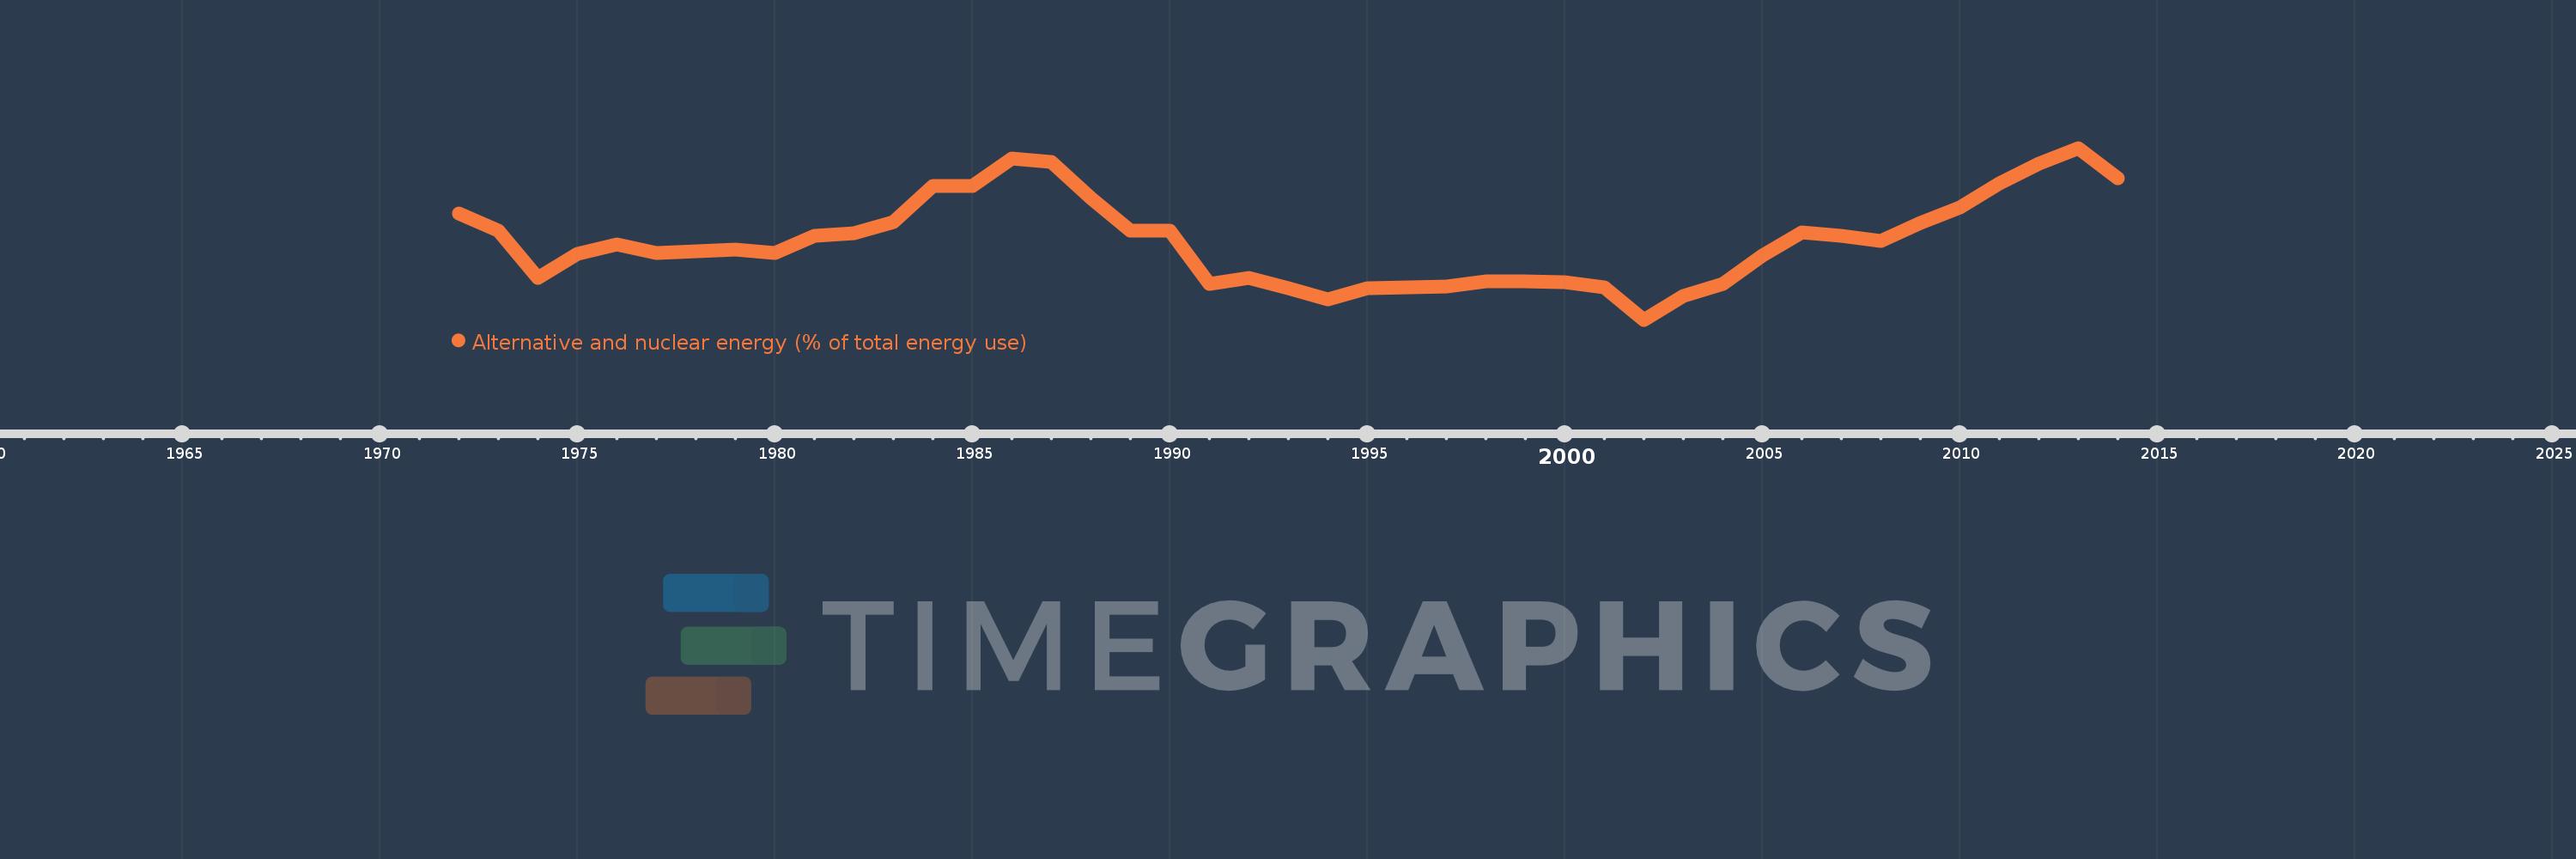
Alternative and nuclear energy (% of total energy use)
2014,2013,2012,2011,2010,2009,2008,2007,2006,2005,2004,2003,2002,2001,2000,1999,1998,1997,1996,1995,1994,1993,1992,1991,1990,1989,1988,1987,1986,1985,1984,1983,1982,1981,1980,1979,1978,1977,1976,1975,1974,1973,1972
Estas estadísticas en otros países:
AlbaniaAlgeriaAngolaArab WorldArgentinaArmeniaAustraliaAustriaAzerbaijanBahrainBangladeshBelarusBelgiumBeninBoliviaBosnia and HerzegovinaBotswanaBrazilBrunei DarussalamBulgariaCambodiaCameroonCanadaCaribbean small statesCentral Europe and the BalticsChileChinaColombiaCongo, Dem. Rep.Congo, Rep.Costa RicaCote d'IvoireCroatiaCubaCuracaoCyprusCzech RepublicDenmarkDominican RepublicEarly-demographic dividendEast Asia & PacificEast Asia & Pacific (excluding high income)East Asia & Pacific (IDA & IBRD countries)EcuadorEgypt, Arab Rep.El SalvadorEritreaEstoniaEthiopiaEuro areaEurope & Central AsiaEurope & Central Asia (excluding high income)Europe & Central Asia (IDA & IBRD countries)European UnionFinlandFragile and conflict affected situationsFranceGabonGeorgiaGermanyGhanaGibraltarGreeceGuatemalaHaitiHeavily indebted poor countries (HIPC)High incomeHondurasHong Kong SAR, ChinaHungaryIBRD onlyIcelandIDA & IBRD totalIDA blendIDA onlyIDA totalIndiaIndonesiaIran, Islamic Rep.IraqIrelandIsraelItalyJamaicaJapanJordanKazakhstanKenyaKorea, Dem. People’s Rep.Korea, Rep.KosovoKuwaitKyrgyz RepublicLate-demographic dividendLatin America & Caribbean Latin America & Caribbean (excluding high income)Latin America & the Caribbean (IDA & IBRD countries)LatviaLeast developed countries: UN classificationLebanonLibyaLithuaniaLow & middle incomeLow incomeLower middle incomeLuxembourgMacedonia, FYRMalaysiaMaltaMauritiusMexicoMiddle East & North AfricaMiddle East & North Africa (excluding high income)Middle East & North Africa (IDA & IBRD countries)Middle incomeMoldovaMongoliaMontenegroMoroccoMozambiqueMyanmarNamibiaNepalNetherlandsNew ZealandNicaraguaNigerNigeriaNorth AmericaNorwayOECD membersOmanOther small statesPakistanPanamaParaguayPeruPhilippinesPolandPortugalPost-demographic dividendPre-demographic dividendQatarRomaniaRussian FederationSaudi ArabiaSenegalSerbiaSingaporeSlovak RepublicSloveniaSmall statesSouth AfricaSouth AsiaSouth Asia (IDA & IBRD)South SudanSpainSri LankaSub-Saharan Africa Sub-Saharan Africa (excluding high income)Sub-Saharan Africa (IDA & IBRD countries)SudanSwedenSwitzerlandSyrian Arab RepublicTajikistanTanzaniaThailandTogoTrinidad and TobagoTunisiaTurkeyTurkmenistanUkraineUnited Arab EmiratesUnited KingdomUnited StatesUpper middle incomeUruguayUzbekistanVenezuela, RBVietnamWorldYemen, Rep.ZambiaZimbabwe línea de tiempo (timeline):
En esta escala de tiempo se presenta un gráfico de 1972 y 2014 de Jamaica. Los datos de 1971 están ausentes. El número de observaciones reales por fecha: 43.
Fuente (nombre):
Indicadores del desarrollo mundial
Fuente (organización):
IEA Statistics © OECD/IEA 2014 (http://www.iea.org/stats/index.asp), subject to https://www.iea.org/t&c/termsandconditions/
Categorías:
Energy & Mining
Se ha actualizado:
23 abr 2017 año
Los indicadores de los cambios de valor en los últimos años
Mínimo:
0.134
1 ene 2002 año
Máximo:
0.789
1 ene 2013 año
A la fecha de observación
Valor
Cambio absoluto
El cambio con respecto al valor anterior
1 ene 1972 año
0.539
+0.539
0.0%
1 ene 1973 año
0.473
-0.066
-12.27%
1 ene 1974 año
0.292
-0.181
-38.27%
1 ene 1975 año
0.384
+0.092
31.63%
1 ene 1976 año
0.42
+0.036
9.33%
1 ene 1977 año
0.389
-0.031
-7.41%
1 ene 1978 año
0.395
+0.006
1.45%
1 ene 1979 año
0.401
+0.006
1.52%
1 ene 1980 año
0.387
-0.014
-3.38%
1 ene 1981 año
0.453
+0.066
17.02%
1 ene 1982 año
0.463
+0.01
2.21%
1 ene 1983 año
0.507
+0.044
9.57%
1 ene 1984 año
0.644
+0.137
27.06%
1 ene 1985 año
0.643
-0.001
-0.23%
1 ene 1986 año
0.748
+0.105
16.34%
1 ene 1987 año
0.736
-0.012
-1.59%
1 ene 1988 año
0.597
-0.139
-18.85%
1 ene 1989 año
0.473
-0.124
-20.75%
1 ene 1990 año
0.475
+0.001
0.26%
1 ene 1991 año
0.272
-0.203
-42.75%
1 ene 1992 año
0.295
+0.023
8.65%
1 ene 1993 año
0.254
-0.041
-13.93%
1 ene 1994 año
0.21
-0.045
-17.54%
1 ene 1995 año
0.254
+0.044
21.21%
1 ene 1996 año
0.258
+0.004
1.39%
1 ene 1997 año
0.26
+0.002
0.82%
1 ene 1998 año
0.28
+0.02
7.82%
1 ene 1999 año
0.279
-0.001
-0.28%
1 ene 2000 año
0.276
-0.003
-1.14%
1 ene 2001 año
0.258
-0.018
-6.53%
1 ene 2002 año
0.134
-0.124
-47.97%
1 ene 2003 año
0.225
+0.091
67.93%
1 ene 2004 año
0.27
+0.044
19.69%
1 ene 2005 año
0.379
+0.109
40.35%
1 ene 2006 año
0.467
+0.088
23.37%
1 ene 2007 año
0.455
-0.012
-2.6%
1 ene 2008 año
0.434
-0.021
-4.63%
1 ene 2009 año
0.503
+0.069
15.88%
1 ene 2010 año
0.563
+0.06
11.98%
1 ene 2011 año
0.655
+0.092
16.29%
1 ene 2012 año
0.728
+0.073
11.17%
1 ene 2013 año
0.789
+0.062
8.47%
1 ene 2014 año
0.675
-0.114
-14.46%
Ranking de los países por los datos estadísticos actuales


Comentarios: