29
/es/
es
AIzaSyAYiBZKx7MnpbEhh9jyipgxe19OcubqV5w
April 1, 2024
221812
Peru
PER
true
2
1
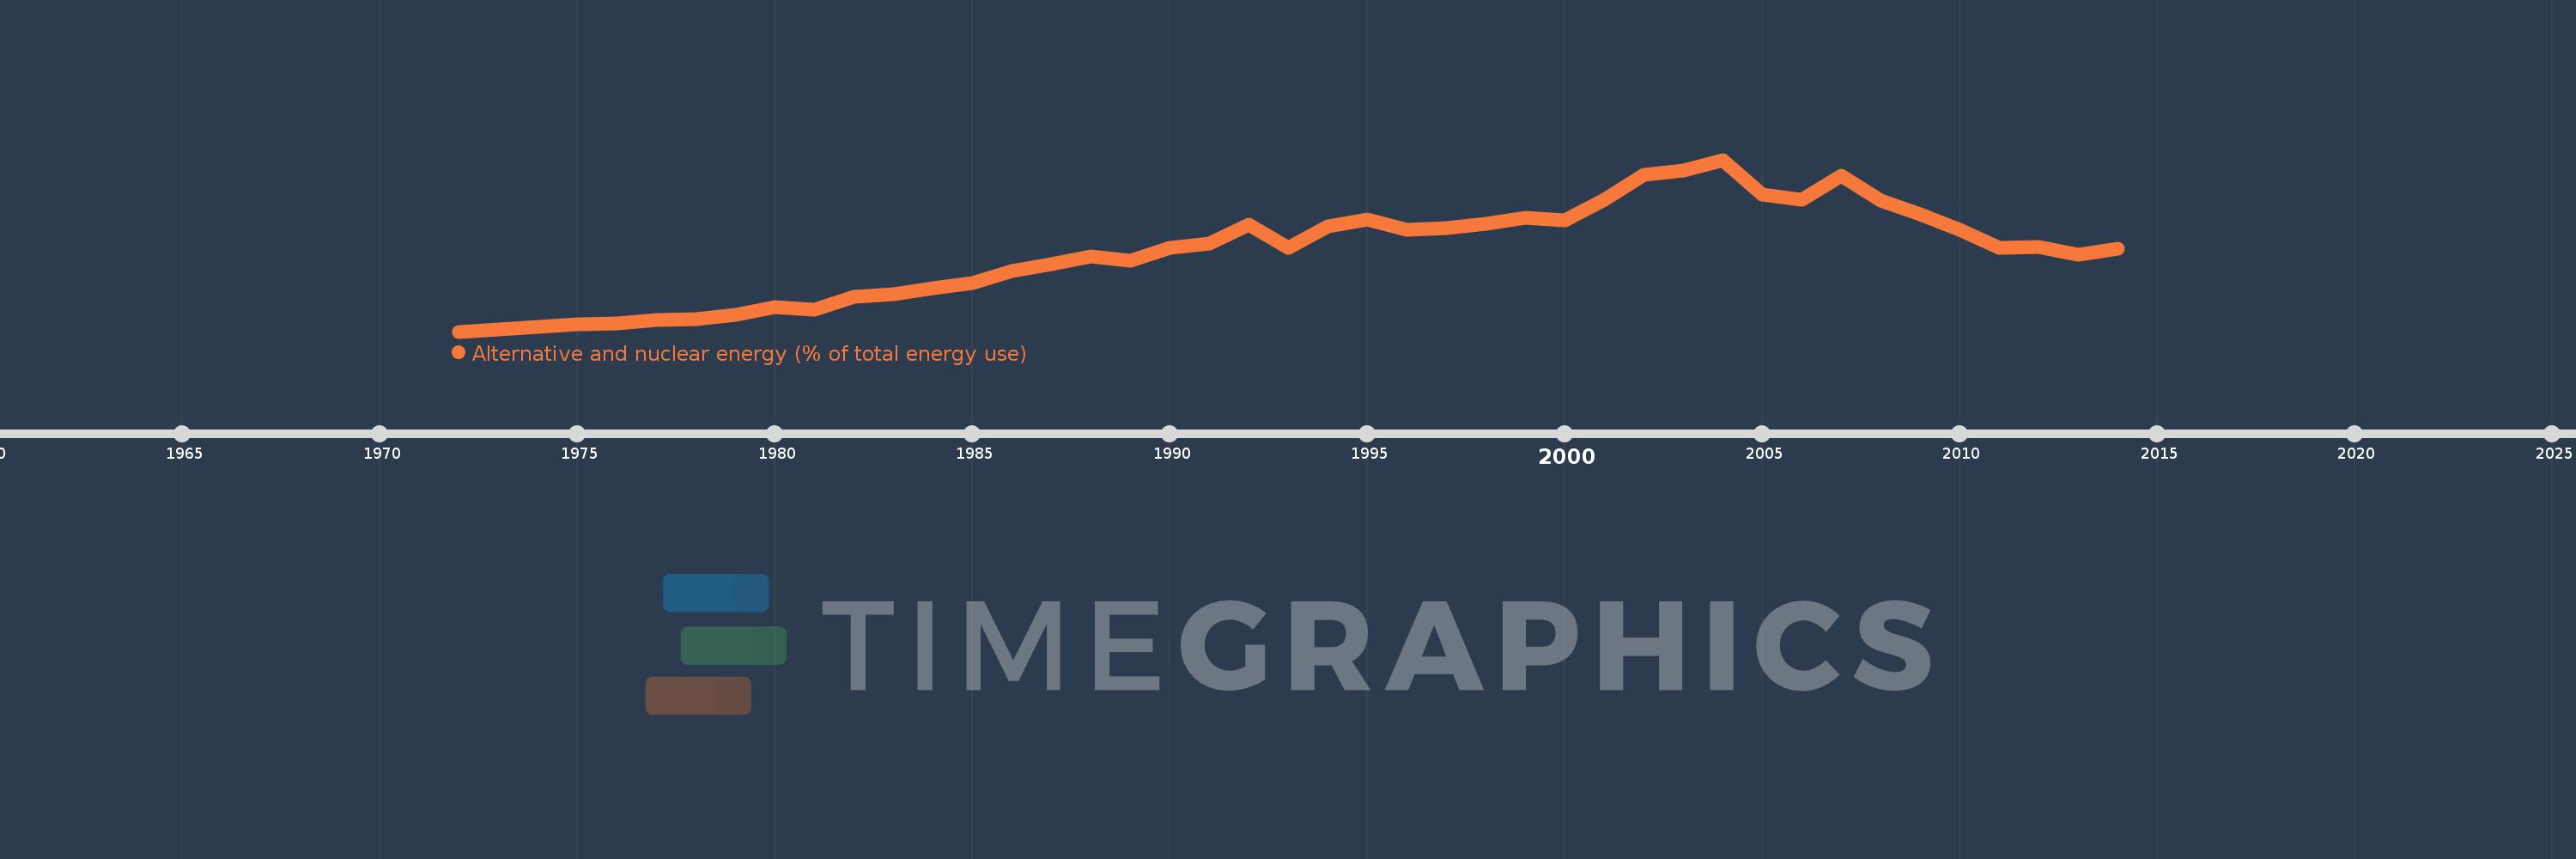
Alternative and nuclear energy (% of total energy use)
2014,2013,2012,2011,2010,2009,2008,2007,2006,2005,2004,2003,2002,2001,2000,1999,1998,1997,1996,1995,1994,1993,1992,1991,1990,1989,1988,1987,1986,1985,1984,1983,1982,1981,1980,1979,1978,1977,1976,1975,1974,1973,1972
Estas estadísticas en otros países:
AlbaniaAlgeriaAngolaArab WorldArgentinaArmeniaAustraliaAustriaAzerbaijanBahrainBangladeshBelarusBelgiumBeninBoliviaBosnia and HerzegovinaBotswanaBrazilBrunei DarussalamBulgariaCambodiaCameroonCanadaCaribbean small statesCentral Europe and the BalticsChileChinaColombiaCongo, Dem. Rep.Congo, Rep.Costa RicaCote d'IvoireCroatiaCubaCuracaoCyprusCzech RepublicDenmarkDominican RepublicEarly-demographic dividendEast Asia & PacificEast Asia & Pacific (excluding high income)East Asia & Pacific (IDA & IBRD countries)EcuadorEgypt, Arab Rep.El SalvadorEritreaEstoniaEthiopiaEuro areaEurope & Central AsiaEurope & Central Asia (excluding high income)Europe & Central Asia (IDA & IBRD countries)European UnionFinlandFragile and conflict affected situationsFranceGabonGeorgiaGermanyGhanaGibraltarGreeceGuatemalaHaitiHeavily indebted poor countries (HIPC)High incomeHondurasHong Kong SAR, ChinaHungaryIBRD onlyIcelandIDA & IBRD totalIDA blendIDA onlyIDA totalIndiaIndonesiaIran, Islamic Rep.IraqIrelandIsraelItalyJamaicaJapanJordanKazakhstanKenyaKorea, Dem. People’s Rep.Korea, Rep.KosovoKuwaitKyrgyz RepublicLate-demographic dividendLatin America & Caribbean Latin America & Caribbean (excluding high income)Latin America & the Caribbean (IDA & IBRD countries)LatviaLeast developed countries: UN classificationLebanonLibyaLithuaniaLow & middle incomeLow incomeLower middle incomeLuxembourgMacedonia, FYRMalaysiaMaltaMauritiusMexicoMiddle East & North AfricaMiddle East & North Africa (excluding high income)Middle East & North Africa (IDA & IBRD countries)Middle incomeMoldovaMongoliaMontenegroMoroccoMozambiqueMyanmarNamibiaNepalNetherlandsNew ZealandNicaraguaNigerNigeriaNorth AmericaNorwayOECD membersOmanOther small statesPakistanPanamaParaguayPeruPhilippinesPolandPortugalPost-demographic dividendPre-demographic dividendQatarRomaniaRussian FederationSaudi ArabiaSenegalSerbiaSingaporeSlovak RepublicSloveniaSmall statesSouth AfricaSouth AsiaSouth Asia (IDA & IBRD)South SudanSpainSri LankaSub-Saharan Africa Sub-Saharan Africa (excluding high income)Sub-Saharan Africa (IDA & IBRD countries)SudanSwedenSwitzerlandSyrian Arab RepublicTajikistanTanzaniaThailandTogoTrinidad and TobagoTunisiaTurkeyTurkmenistanUkraineUnited Arab EmiratesUnited KingdomUnited StatesUpper middle incomeUruguayUzbekistanVenezuela, RBVietnamWorldYemen, Rep.ZambiaZimbabwe línea de tiempo (timeline):
En esta escala de tiempo se presenta un gráfico de 1972 y 2014 de Peru. Los datos de 1971 están ausentes. El número de observaciones reales por fecha: 43.
Fuente (nombre):
Indicadores del desarrollo mundial
Fuente (organización):
IEA Statistics © OECD/IEA 2014 (http://www.iea.org/stats/index.asp), subject to https://www.iea.org/t&c/termsandconditions/
Categorías:
Energy & Mining
Se ha actualizado:
23 abr 2017 año
Los indicadores de los cambios de valor en los últimos años
Mínimo:
4.038
1 ene 1972 año
Máximo:
14.172
1 ene 2004 año
A la fecha de observación
Valor
Cambio absoluto
El cambio con respecto al valor anterior
1 ene 1972 año
4.038
+4.038
0.0%
1 ene 1973 año
4.177
+0.139
3.45%
1 ene 1974 año
4.312
+0.135
3.23%
1 ene 1975 año
4.458
+0.146
3.39%
1 ene 1976 año
4.54
+0.082
1.84%
1 ene 1977 año
4.737
+0.197
4.33%
1 ene 1978 año
4.755
+0.017
0.37%
1 ene 1979 año
5.034
+0.28
5.88%
1 ene 1980 año
5.469
+0.434
8.63%
1 ene 1981 año
5.355
-0.114
-2.08%
1 ene 1982 año
6.071
+0.716
13.36%
1 ene 1983 año
6.261
+0.191
3.14%
1 ene 1984 año
6.575
+0.314
5.01%
1 ene 1985 año
6.89
+0.314
4.78%
1 ene 1986 año
7.626
+0.737
10.69%
1 ene 1987 año
8.029
+0.403
5.28%
1 ene 1988 año
8.456
+0.427
5.32%
1 ene 1989 año
8.238
-0.218
-2.58%
1 ene 1990 año
8.997
+0.76
9.22%
1 ene 1991 año
9.249
+0.252
2.8%
1 ene 1992 año
10.35
+1.101
11.9%
1 ene 1993 año
8.973
-1.377
-13.31%
1 ene 1994 año
10.235
+1.263
14.07%
1 ene 1995 año
10.675
+0.439
4.29%
1 ene 1996 año
10.05
-0.624
-5.85%
1 ene 1997 año
10.14
+0.09
0.89%
1 ene 1998 año
10.381
+0.241
2.38%
1 ene 1999 año
10.763
+0.382
3.68%
1 ene 2000 año
10.623
-0.14
-1.3%
1 ene 2001 año
11.811
+1.188
11.18%
1 ene 2002 año
13.293
+1.482
12.55%
1 ene 2003 año
13.526
+0.234
1.76%
1 ene 2004 año
14.172
+0.646
4.77%
1 ene 2005 año
12.143
-2.029
-14.32%
1 ene 2006 año
11.801
-0.342
-2.82%
1 ene 2007 año
13.213
+1.412
11.96%
1 ene 2008 año
11.779
-1.434
-10.85%
1 ene 2009 año
10.939
-0.839
-7.13%
1 ene 2010 año
10.066
-0.873
-7.98%
1 ene 2011 año
9.002
-1.064
-10.57%
1 ene 2012 año
9.035
+0.033
0.37%
1 ene 2013 año
8.565
-0.47
-5.21%
1 ene 2014 año
8.941
+0.376
4.39%
Ranking de los países por los datos estadísticos actuales


Comentarios: