29
/es/
es
AIzaSyAYiBZKx7MnpbEhh9jyipgxe19OcubqV5w
April 1, 2024
212603
Nigeria
NGA
true
2
1
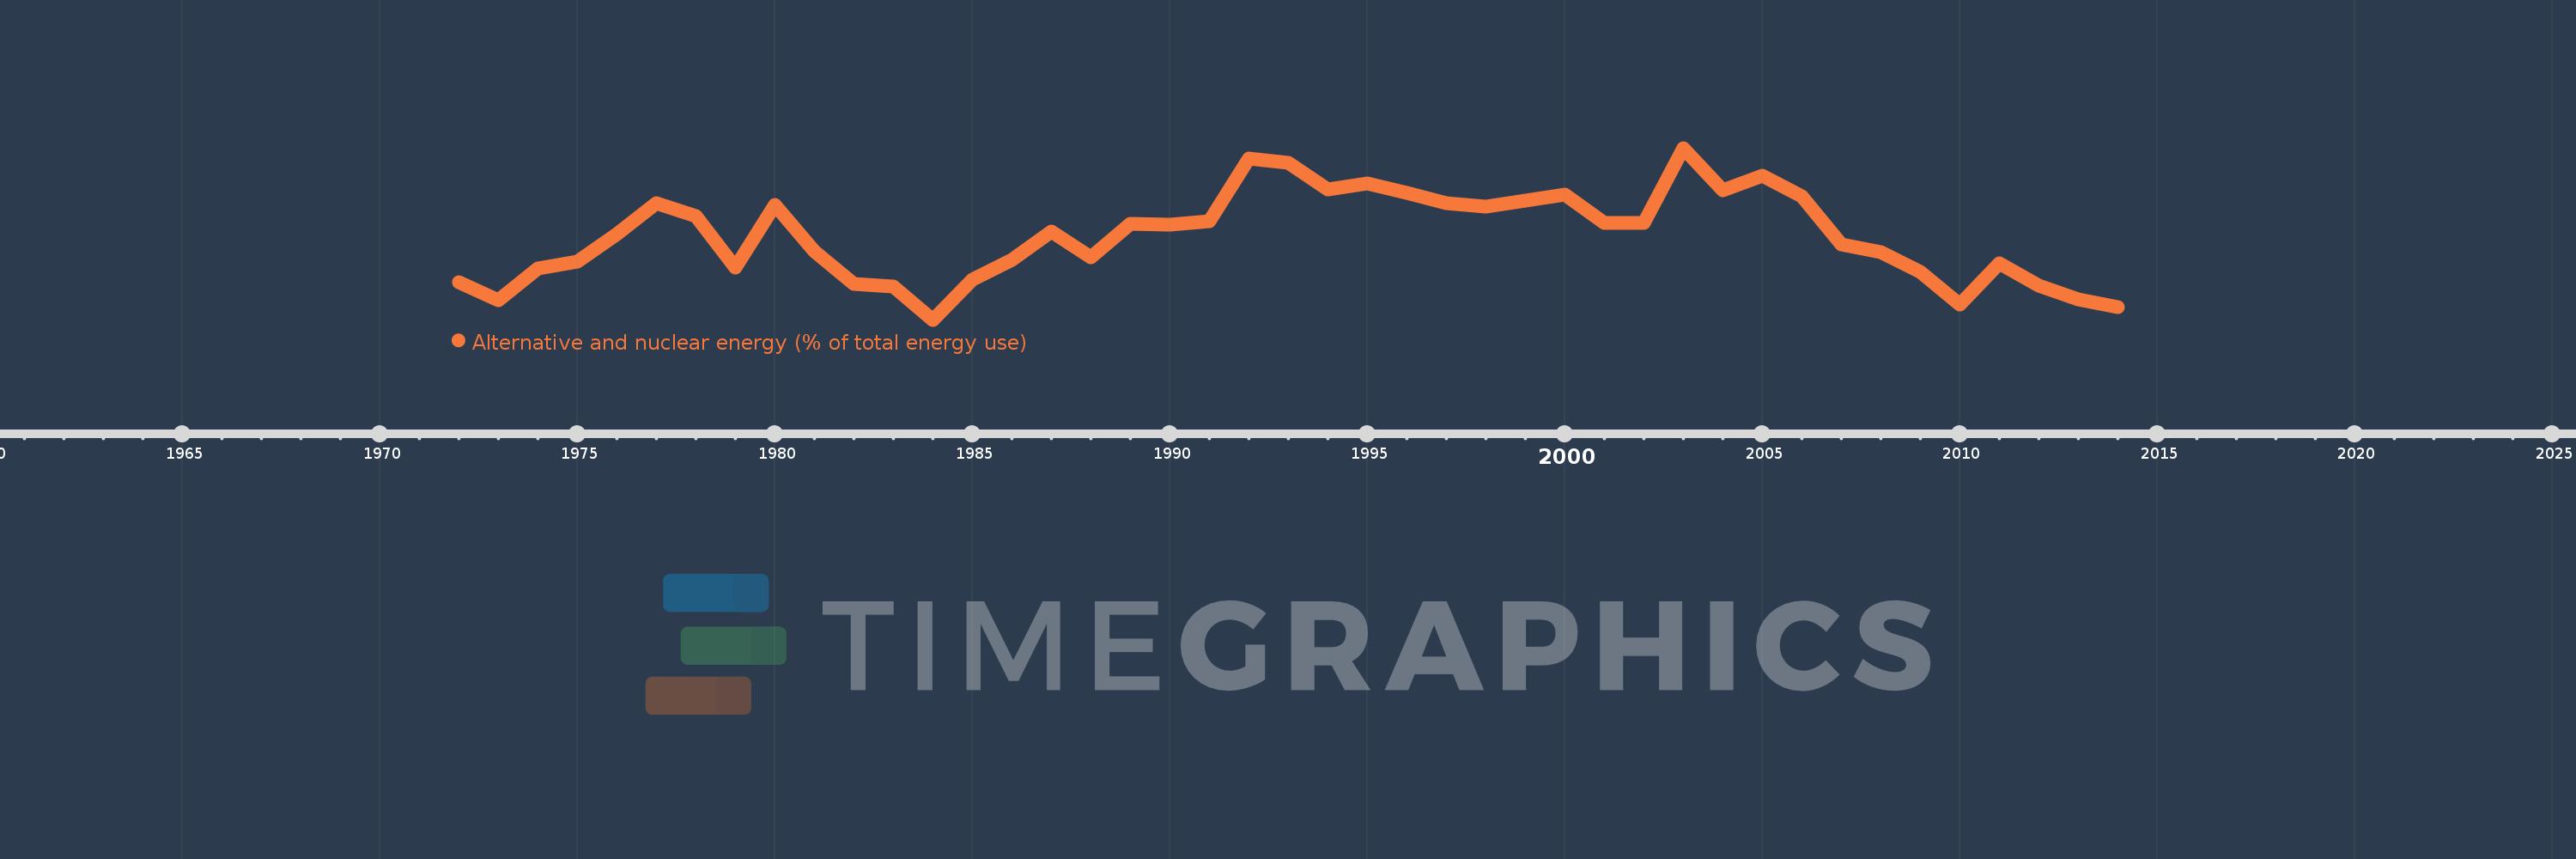
Alternative and nuclear energy (% of total energy use)
2014,2013,2012,2011,2010,2009,2008,2007,2006,2005,2004,2003,2002,2001,2000,1999,1998,1997,1996,1995,1994,1993,1992,1991,1990,1989,1988,1987,1986,1985,1984,1983,1982,1981,1980,1979,1978,1977,1976,1975,1974,1973,1972
Estas estadísticas en otros países:
AlbaniaAlgeriaAngolaArab WorldArgentinaArmeniaAustraliaAustriaAzerbaijanBahrainBangladeshBelarusBelgiumBeninBoliviaBosnia and HerzegovinaBotswanaBrazilBrunei DarussalamBulgariaCambodiaCameroonCanadaCaribbean small statesCentral Europe and the BalticsChileChinaColombiaCongo, Dem. Rep.Congo, Rep.Costa RicaCote d'IvoireCroatiaCubaCuracaoCyprusCzech RepublicDenmarkDominican RepublicEarly-demographic dividendEast Asia & PacificEast Asia & Pacific (excluding high income)East Asia & Pacific (IDA & IBRD countries)EcuadorEgypt, Arab Rep.El SalvadorEritreaEstoniaEthiopiaEuro areaEurope & Central AsiaEurope & Central Asia (excluding high income)Europe & Central Asia (IDA & IBRD countries)European UnionFinlandFragile and conflict affected situationsFranceGabonGeorgiaGermanyGhanaGibraltarGreeceGuatemalaHaitiHeavily indebted poor countries (HIPC)High incomeHondurasHong Kong SAR, ChinaHungaryIBRD onlyIcelandIDA & IBRD totalIDA blendIDA onlyIDA totalIndiaIndonesiaIran, Islamic Rep.IraqIrelandIsraelItalyJamaicaJapanJordanKazakhstanKenyaKorea, Dem. People’s Rep.Korea, Rep.KosovoKuwaitKyrgyz RepublicLate-demographic dividendLatin America & Caribbean Latin America & Caribbean (excluding high income)Latin America & the Caribbean (IDA & IBRD countries)LatviaLeast developed countries: UN classificationLebanonLibyaLithuaniaLow & middle incomeLow incomeLower middle incomeLuxembourgMacedonia, FYRMalaysiaMaltaMauritiusMexicoMiddle East & North AfricaMiddle East & North Africa (excluding high income)Middle East & North Africa (IDA & IBRD countries)Middle incomeMoldovaMongoliaMontenegroMoroccoMozambiqueMyanmarNamibiaNepalNetherlandsNew ZealandNicaraguaNigerNigeriaNorth AmericaNorwayOECD membersOmanOther small statesPakistanPanamaParaguayPeruPhilippinesPolandPortugalPost-demographic dividendPre-demographic dividendQatarRomaniaRussian FederationSaudi ArabiaSenegalSerbiaSingaporeSlovak RepublicSloveniaSmall statesSouth AfricaSouth AsiaSouth Asia (IDA & IBRD)South SudanSpainSri LankaSub-Saharan Africa Sub-Saharan Africa (excluding high income)Sub-Saharan Africa (IDA & IBRD countries)SudanSwedenSwitzerlandSyrian Arab RepublicTajikistanTanzaniaThailandTogoTrinidad and TobagoTunisiaTurkeyTurkmenistanUkraineUnited Arab EmiratesUnited KingdomUnited StatesUpper middle incomeUruguayUzbekistanVenezuela, RBVietnamWorldYemen, Rep.ZambiaZimbabwe línea de tiempo (timeline):
En esta escala de tiempo se presenta un gráfico de 1972 y 2014 de Nigeria. Los datos de 1971 están ausentes. El número de observaciones reales por fecha: 43.
Fuente (nombre):
Indicadores del desarrollo mundial
Fuente (organización):
IEA Statistics © OECD/IEA 2014 (http://www.iea.org/stats/index.asp), subject to https://www.iea.org/t&c/termsandconditions/
Categorías:
Energy & Mining
Se ha actualizado:
23 abr 2017 año
Los indicadores de los cambios de valor en los últimos años
Mínimo:
0.31
1 ene 1984 año
Máximo:
0.76
1 ene 2003 año
A la fecha de observación
Valor
Cambio absoluto
El cambio con respecto al valor anterior
1 ene 1972 año
0.408
+0.408
0.0%
1 ene 1973 año
0.362
-0.046
-11.19%
1 ene 1974 año
0.445
+0.083
22.86%
1 ene 1975 año
0.462
+0.017
3.77%
1 ene 1976 año
0.534
+0.072
15.54%
1 ene 1977 año
0.616
+0.082
15.4%
1 ene 1978 año
0.581
-0.035
-5.67%
1 ene 1979 año
0.447
-0.134
-23.14%
1 ene 1980 año
0.61
+0.163
36.5%
1 ene 1981 año
0.49
-0.12
-19.63%
1 ene 1982 año
0.403
-0.087
-17.82%
1 ene 1983 año
0.397
-0.006
-1.43%
1 ene 1984 año
0.31
-0.086
-21.79%
1 ene 1985 año
0.415
+0.105
33.83%
1 ene 1986 año
0.466
+0.05
12.09%
1 ene 1987 año
0.542
+0.076
16.35%
1 ene 1988 año
0.474
-0.068
-12.57%
1 ene 1989 año
0.561
+0.088
18.53%
1 ene 1990 año
0.56
-0.001
-0.19%
1 ene 1991 año
0.568
+0.008
1.38%
1 ene 1992 año
0.733
+0.165
29.01%
1 ene 1993 año
0.72
-0.013
-1.73%
1 ene 1994 año
0.652
-0.068
-9.49%
1 ene 1995 año
0.667
+0.015
2.33%
1 ene 1996 año
0.642
-0.025
-3.77%
1 ene 1997 año
0.616
-0.026
-4.08%
1 ene 1998 año
0.606
-0.01
-1.64%
1 ene 1999 año
0.621
+0.015
2.55%
1 ene 2000 año
0.638
+0.017
2.78%
1 ene 2001 año
0.563
-0.076
-11.87%
1 ene 2002 año
0.563
+0.0
0.0%
1 ene 2003 año
0.76
+0.197
35.03%
1 ene 2004 año
0.65
-0.109
-14.41%
1 ene 2005 año
0.688
+0.038
5.87%
1 ene 2006 año
0.634
-0.054
-7.83%
1 ene 2007 año
0.507
-0.127
-20.04%
1 ene 2008 año
0.487
-0.02
-3.97%
1 ene 2009 año
0.435
-0.053
-10.79%
1 ene 2010 año
0.349
-0.085
-19.58%
1 ene 2011 año
0.457
+0.107
30.74%
1 ene 2012 año
0.399
-0.058
-12.76%
1 ene 2013 año
0.363
-0.035
-8.9%
1 ene 2014 año
0.343
-0.02
-5.58%
Ranking de los países por los datos estadísticos actuales


Comentarios: