29
/es/
es
AIzaSyAYiBZKx7MnpbEhh9jyipgxe19OcubqV5w
April 1, 2024
111867
Costa Rica
CRI
true
2
1
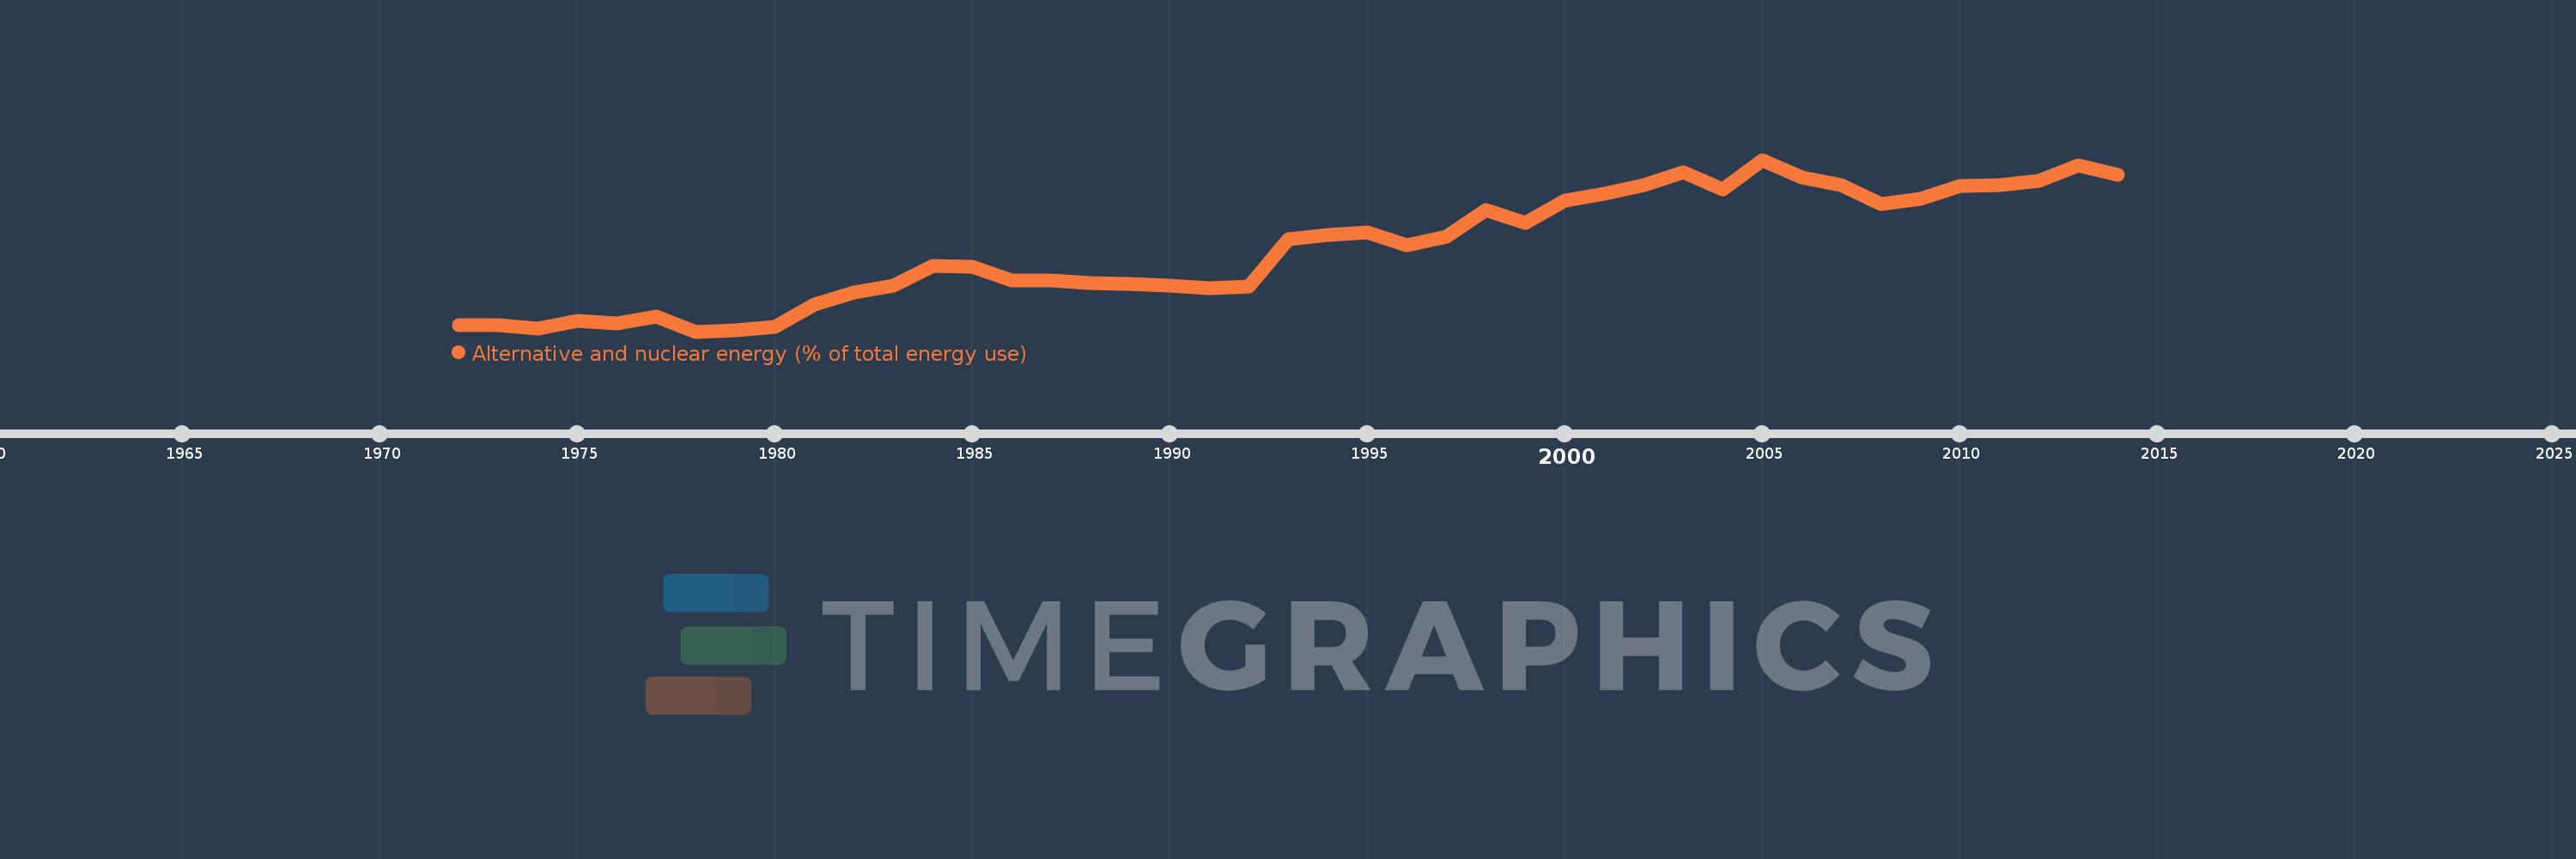
Alternative and nuclear energy (% of total energy use)
2014,2013,2012,2011,2010,2009,2008,2007,2006,2005,2004,2003,2002,2001,2000,1999,1998,1997,1996,1995,1994,1993,1992,1991,1990,1989,1988,1987,1986,1985,1984,1983,1982,1981,1980,1979,1978,1977,1976,1975,1974,1973,1972
Estas estadísticas en otros países:
AlbaniaAlgeriaAngolaArab WorldArgentinaArmeniaAustraliaAustriaAzerbaijanBahrainBangladeshBelarusBelgiumBeninBoliviaBosnia and HerzegovinaBotswanaBrazilBrunei DarussalamBulgariaCambodiaCameroonCanadaCaribbean small statesCentral Europe and the BalticsChileChinaColombiaCongo, Dem. Rep.Congo, Rep.Costa RicaCote d'IvoireCroatiaCubaCuracaoCyprusCzech RepublicDenmarkDominican RepublicEarly-demographic dividendEast Asia & PacificEast Asia & Pacific (excluding high income)East Asia & Pacific (IDA & IBRD countries)EcuadorEgypt, Arab Rep.El SalvadorEritreaEstoniaEthiopiaEuro areaEurope & Central AsiaEurope & Central Asia (excluding high income)Europe & Central Asia (IDA & IBRD countries)European UnionFinlandFragile and conflict affected situationsFranceGabonGeorgiaGermanyGhanaGibraltarGreeceGuatemalaHaitiHeavily indebted poor countries (HIPC)High incomeHondurasHong Kong SAR, ChinaHungaryIBRD onlyIcelandIDA & IBRD totalIDA blendIDA onlyIDA totalIndiaIndonesiaIran, Islamic Rep.IraqIrelandIsraelItalyJamaicaJapanJordanKazakhstanKenyaKorea, Dem. People’s Rep.Korea, Rep.KosovoKuwaitKyrgyz RepublicLate-demographic dividendLatin America & Caribbean Latin America & Caribbean (excluding high income)Latin America & the Caribbean (IDA & IBRD countries)LatviaLeast developed countries: UN classificationLebanonLibyaLithuaniaLow & middle incomeLow incomeLower middle incomeLuxembourgMacedonia, FYRMalaysiaMaltaMauritiusMexicoMiddle East & North AfricaMiddle East & North Africa (excluding high income)Middle East & North Africa (IDA & IBRD countries)Middle incomeMoldovaMongoliaMontenegroMoroccoMozambiqueMyanmarNamibiaNepalNetherlandsNew ZealandNicaraguaNigerNigeriaNorth AmericaNorwayOECD membersOmanOther small statesPakistanPanamaParaguayPeruPhilippinesPolandPortugalPost-demographic dividendPre-demographic dividendQatarRomaniaRussian FederationSaudi ArabiaSenegalSerbiaSingaporeSlovak RepublicSloveniaSmall statesSouth AfricaSouth AsiaSouth Asia (IDA & IBRD)South SudanSpainSri LankaSub-Saharan Africa Sub-Saharan Africa (excluding high income)Sub-Saharan Africa (IDA & IBRD countries)SudanSwedenSwitzerlandSyrian Arab RepublicTajikistanTanzaniaThailandTogoTrinidad and TobagoTunisiaTurkeyTurkmenistanUkraineUnited Arab EmiratesUnited KingdomUnited StatesUpper middle incomeUruguayUzbekistanVenezuela, RBVietnamWorldYemen, Rep.ZambiaZimbabwe línea de tiempo (timeline):
En esta escala de tiempo se presenta un gráfico de 1972 y 2014 de Costa Rica. Los datos de 1971 están ausentes. El número de observaciones reales por fecha: 43.
Fuente (nombre):
Indicadores del desarrollo mundial
Fuente (organización):
IEA Statistics © OECD/IEA 2014 (http://www.iea.org/stats/index.asp), subject to https://www.iea.org/t&c/termsandconditions/
Categorías:
Energy & Mining
Se ha actualizado:
23 abr 2017 año
Los indicadores de los cambios de valor en los últimos años
Mínimo:
9.861
1 ene 1978 año
Máximo:
39.622
1 ene 2005 año
A la fecha de observación
Valor
Cambio absoluto
El cambio con respecto al valor anterior
1 ene 1972 año
10.956
+10.956
0.0%
1 ene 1973 año
10.961
+0.005
0.05%
1 ene 1974 año
10.379
-0.583
-5.32%
1 ene 1975 año
11.712
+1.333
12.85%
1 ene 1976 año
11.216
-0.496
-4.23%
1 ene 1977 año
12.444
+1.228
10.95%
1 ene 1978 año
9.861
-2.584
-20.76%
1 ene 1979 año
10.071
+0.211
2.14%
1 ene 1980 año
10.704
+0.633
6.28%
1 ene 1981 año
14.528
+3.824
35.73%
1 ene 1982 año
16.676
+2.148
14.78%
1 ene 1983 año
17.863
+1.187
7.12%
1 ene 1984 año
21.191
+3.328
18.63%
1 ene 1985 año
21.072
-0.119
-0.56%
1 ene 1986 año
18.765
-2.306
-10.94%
1 ene 1987 año
18.773
+0.007
0.04%
1 ene 1988 año
18.276
-0.497
-2.65%
1 ene 1989 año
18.11
-0.166
-0.91%
1 ene 1990 año
17.772
-0.338
-1.87%
1 ene 1991 año
17.336
-0.436
-2.45%
1 ene 1992 año
17.663
+0.328
1.89%
1 ene 1993 año
25.879
+8.216
46.52%
1 ene 1994 año
26.639
+0.759
2.93%
1 ene 1995 año
27.079
+0.44
1.65%
1 ene 1996 año
24.88
-2.198
-8.12%
1 ene 1997 año
26.338
+1.457
5.86%
1 ene 1998 año
30.886
+4.548
17.27%
1 ene 1999 año
28.669
-2.217
-7.18%
1 ene 2000 año
32.521
+3.852
13.44%
1 ene 2001 año
33.764
+1.243
3.82%
1 ene 2002 año
35.184
+1.42
4.21%
1 ene 2003 año
37.462
+2.278
6.47%
1 ene 2004 año
34.428
-3.034
-8.1%
1 ene 2005 año
39.622
+5.194
15.09%
1 ene 2006 año
36.555
-3.067
-7.74%
1 ene 2007 año
35.224
-1.33
-3.64%
1 ene 2008 año
32.032
-3.192
-9.06%
1 ene 2009 año
32.841
+0.809
2.52%
1 ene 2010 año
35.1
+2.259
6.88%
1 ene 2011 año
35.179
+0.079
0.23%
1 ene 2012 año
36.031
+0.852
2.42%
1 ene 2013 año
38.7
+2.669
7.41%
1 ene 2014 año
37.023
-1.677
-4.33%
Ranking de los países por los datos estadísticos actuales


Comentarios: