29
/es/
es
AIzaSyAYiBZKx7MnpbEhh9jyipgxe19OcubqV5w
April 1, 2024
36364
IBRD only
IBD
false
2
1
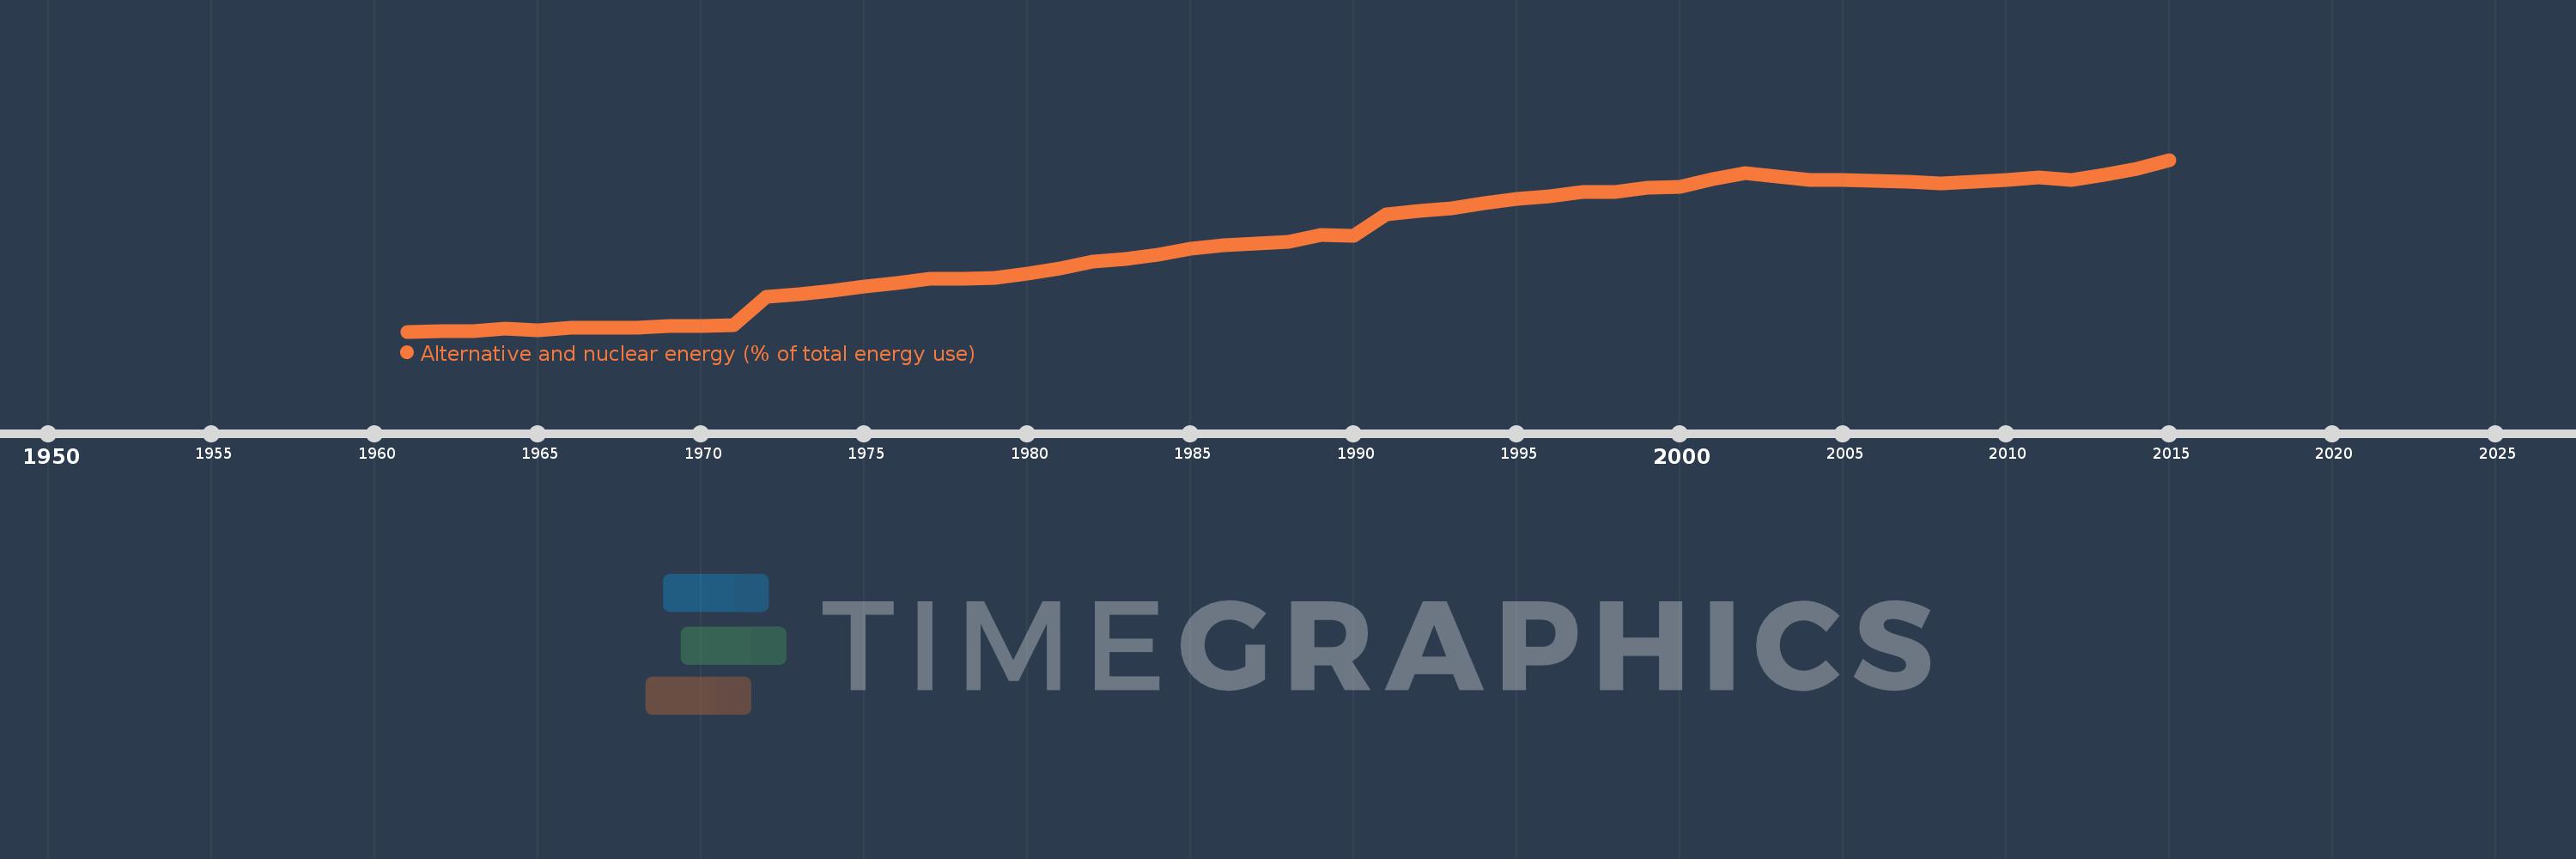
Alternative and nuclear energy (% of total energy use)
2015,2014,2013,2012,2011,2010,2009,2008,2007,2006,2005,2004,2003,2002,2001,2000,1999,1998,1997,1996,1995,1994,1993,1992,1991,1990,1989,1988,1987,1986,1985,1984,1983,1982,1981,1980,1979,1978,1977,1976,1975,1974,1973,1972,1971,1970,1969,1968,1967,1966,1965,1964,1963,1962,1961
Estas estadísticas en otros países:
AlbaniaAlgeriaAngolaArab WorldArgentinaArmeniaAustraliaAustriaAzerbaijanBahrainBangladeshBelarusBelgiumBeninBoliviaBosnia and HerzegovinaBotswanaBrazilBrunei DarussalamBulgariaCambodiaCameroonCanadaCaribbean small statesCentral Europe and the BalticsChileChinaColombiaCongo, Dem. Rep.Congo, Rep.Costa RicaCote d'IvoireCroatiaCubaCuracaoCyprusCzech RepublicDenmarkDominican RepublicEarly-demographic dividendEast Asia & PacificEast Asia & Pacific (excluding high income)East Asia & Pacific (IDA & IBRD countries)EcuadorEgypt, Arab Rep.El SalvadorEritreaEstoniaEthiopiaEuro areaEurope & Central AsiaEurope & Central Asia (excluding high income)Europe & Central Asia (IDA & IBRD countries)European UnionFinlandFragile and conflict affected situationsFranceGabonGeorgiaGermanyGhanaGibraltarGreeceGuatemalaHaitiHeavily indebted poor countries (HIPC)High incomeHondurasHong Kong SAR, ChinaHungaryIBRD onlyIcelandIDA & IBRD totalIDA blendIDA onlyIDA totalIndiaIndonesiaIran, Islamic Rep.IraqIrelandIsraelItalyJamaicaJapanJordanKazakhstanKenyaKorea, Dem. People’s Rep.Korea, Rep.KosovoKuwaitKyrgyz RepublicLate-demographic dividendLatin America & Caribbean Latin America & Caribbean (excluding high income)Latin America & the Caribbean (IDA & IBRD countries)LatviaLeast developed countries: UN classificationLebanonLibyaLithuaniaLow & middle incomeLow incomeLower middle incomeLuxembourgMacedonia, FYRMalaysiaMaltaMauritiusMexicoMiddle East & North AfricaMiddle East & North Africa (excluding high income)Middle East & North Africa (IDA & IBRD countries)Middle incomeMoldovaMongoliaMontenegroMoroccoMozambiqueMyanmarNamibiaNepalNetherlandsNew ZealandNicaraguaNigerNigeriaNorth AmericaNorwayOECD membersOmanOther small statesPakistanPanamaParaguayPeruPhilippinesPolandPortugalPost-demographic dividendPre-demographic dividendQatarRomaniaRussian FederationSaudi ArabiaSenegalSerbiaSingaporeSlovak RepublicSloveniaSmall statesSouth AfricaSouth AsiaSouth Asia (IDA & IBRD)South SudanSpainSri LankaSub-Saharan Africa Sub-Saharan Africa (excluding high income)Sub-Saharan Africa (IDA & IBRD countries)SudanSwedenSwitzerlandSyrian Arab RepublicTajikistanTanzaniaThailandTogoTrinidad and TobagoTunisiaTurkeyTurkmenistanUkraineUnited Arab EmiratesUnited KingdomUnited StatesUpper middle incomeUruguayUzbekistanVenezuela, RBVietnamWorldYemen, Rep.ZambiaZimbabwe línea de tiempo (timeline):
En esta escala de tiempo se presenta un gráfico de 1961 y 2015 de IBRD only. Los datos de 1960 están ausentes. El número de observaciones reales por fecha: 55.
Fuente (nombre):
Indicadores del desarrollo mundial
Fuente (organización):
IEA Statistics © OECD/IEA 2014 (http://www.iea.org/stats/index.asp), subject to https://www.iea.org/t&c/termsandconditions/
Categorías:
Energy & Mining
Se ha actualizado:
23 abr 2017 año
Los indicadores de los cambios de valor en los últimos años
Mínimo:
0.217
1 ene 1961 año
Máximo:
5.875
1 ene 2015 año
A la fecha de observación
Valor
Cambio absoluto
El cambio con respecto al valor anterior
1 ene 1961 año
0.217
+0.217
0.0%
1 ene 1962 año
0.238
+0.021
9.75%
1 ene 1963 año
0.225
-0.013
-5.35%
1 ene 1964 año
0.327
+0.102
45.32%
1 ene 1965 año
0.269
-0.058
-17.62%
1 ene 1966 año
0.342
+0.072
26.91%
1 ene 1967 año
0.344
+0.002
0.57%
1 ene 1968 año
0.342
-0.002
-0.51%
1 ene 1969 año
0.407
+0.065
18.89%
1 ene 1970 año
0.387
-0.02
-4.87%
1 ene 1971 año
0.429
+0.042
10.94%
1 ene 1972 año
1.373
+0.944
219.95%
1 ene 1973 año
1.454
+0.081
5.89%
1 ene 1974 año
1.555
+0.101
6.95%
1 ene 1975 año
1.711
+0.156
10.05%
1 ene 1976 año
1.81
+0.099
5.78%
1 ene 1977 año
1.947
+0.136
7.54%
1 ene 1978 año
1.956
+0.009
0.49%
1 ene 1979 año
1.991
+0.035
1.77%
1 ene 1980 año
2.127
+0.136
6.82%
1 ene 1981 año
2.308
+0.182
8.54%
1 ene 1982 año
2.526
+0.218
9.44%
1 ene 1983 año
2.601
+0.075
2.97%
1 ene 1984 año
2.761
+0.16
6.15%
1 ene 1985 año
2.95
+0.19
6.87%
1 ene 1986 año
3.062
+0.111
3.77%
1 ene 1987 año
3.126
+0.064
2.1%
1 ene 1988 año
3.178
+0.052
1.67%
1 ene 1989 año
3.393
+0.214
6.74%
1 ene 1990 año
3.379
-0.014
-0.41%
1 ene 1991 año
4.069
+0.69
20.44%
1 ene 1992 año
4.178
+0.109
2.67%
1 ene 1993 año
4.282
+0.105
2.5%
1 ene 1994 año
4.439
+0.157
3.66%
1 ene 1995 año
4.584
+0.145
3.26%
1 ene 1996 año
4.68
+0.097
2.11%
1 ene 1997 año
4.818
+0.138
2.94%
1 ene 1998 año
4.826
+0.008
0.17%
1 ene 1999 año
4.943
+0.117
2.41%
1 ene 2000 año
4.998
+0.055
1.12%
1 ene 2001 año
5.243
+0.245
4.9%
1 ene 2002 año
5.424
+0.181
3.45%
1 ene 2003 año
5.322
-0.102
-1.88%
1 ene 2004 año
5.217
-0.105
-1.97%
1 ene 2005 año
5.209
-0.009
-0.16%
1 ene 2006 año
5.186
-0.023
-0.44%
1 ene 2007 año
5.158
-0.028
-0.54%
1 ene 2008 año
5.098
-0.06
-1.17%
1 ene 2009 año
5.165
+0.068
1.32%
1 ene 2010 año
5.213
+0.048
0.93%
1 ene 2011 año
5.282
+0.068
1.31%
1 ene 2012 año
5.222
-0.059
-1.12%
1 ene 2013 año
5.379
+0.156
3.0%
1 ene 2014 año
5.578
+0.199
3.7%
1 ene 2015 año
5.875
+0.298
5.34%
Ranking de los países por los datos estadísticos actuales


Comentarios: