29
/es/
es
AIzaSyAYiBZKx7MnpbEhh9jyipgxe19OcubqV5w
April 1, 2024
228111
Romania
ROU
true
2
1
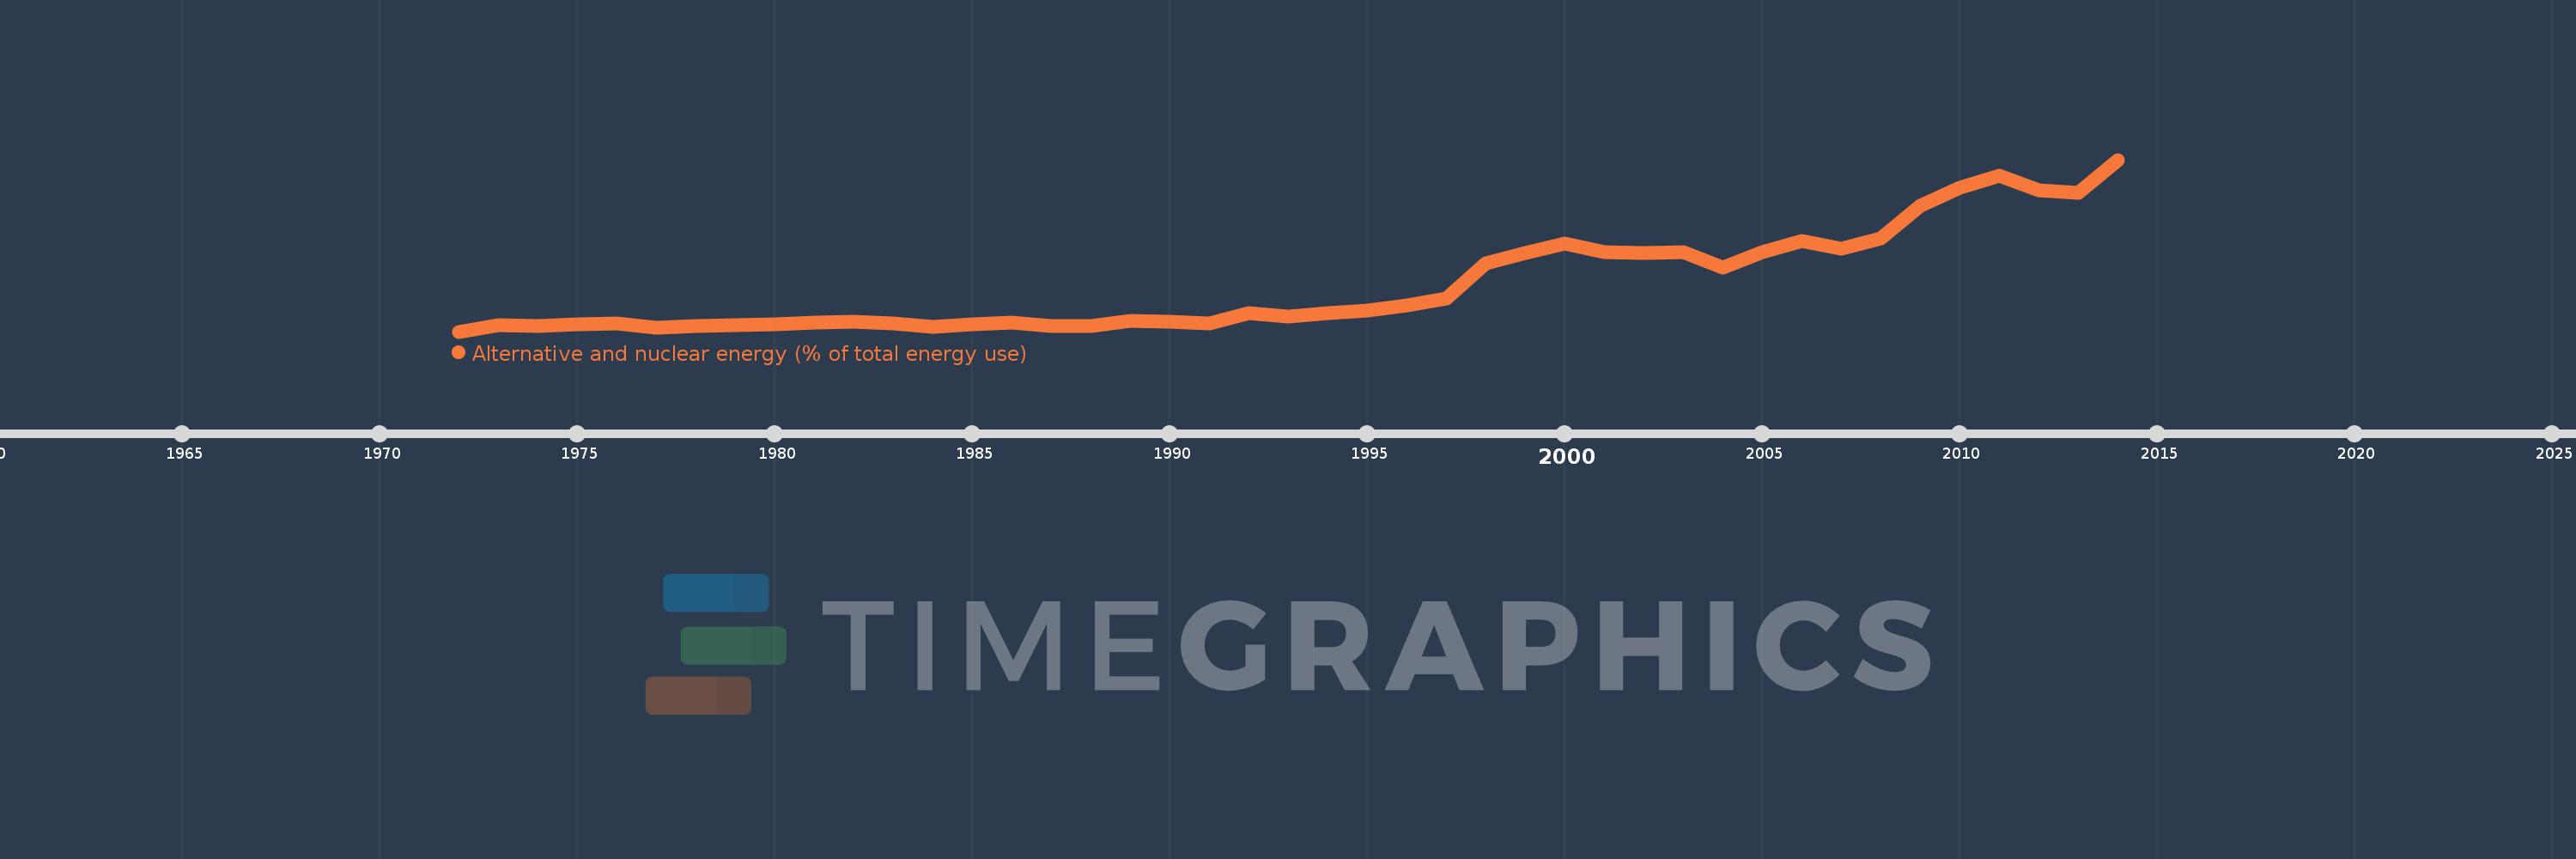
Alternative and nuclear energy (% of total energy use)
2014,2013,2012,2011,2010,2009,2008,2007,2006,2005,2004,2003,2002,2001,2000,1999,1998,1997,1996,1995,1994,1993,1992,1991,1990,1989,1988,1987,1986,1985,1984,1983,1982,1981,1980,1979,1978,1977,1976,1975,1974,1973,1972
Estas estadísticas en otros países:
AlbaniaAlgeriaAngolaArab WorldArgentinaArmeniaAustraliaAustriaAzerbaijanBahrainBangladeshBelarusBelgiumBeninBoliviaBosnia and HerzegovinaBotswanaBrazilBrunei DarussalamBulgariaCambodiaCameroonCanadaCaribbean small statesCentral Europe and the BalticsChileChinaColombiaCongo, Dem. Rep.Congo, Rep.Costa RicaCote d'IvoireCroatiaCubaCuracaoCyprusCzech RepublicDenmarkDominican RepublicEarly-demographic dividendEast Asia & PacificEast Asia & Pacific (excluding high income)East Asia & Pacific (IDA & IBRD countries)EcuadorEgypt, Arab Rep.El SalvadorEritreaEstoniaEthiopiaEuro areaEurope & Central AsiaEurope & Central Asia (excluding high income)Europe & Central Asia (IDA & IBRD countries)European UnionFinlandFragile and conflict affected situationsFranceGabonGeorgiaGermanyGhanaGibraltarGreeceGuatemalaHaitiHeavily indebted poor countries (HIPC)High incomeHondurasHong Kong SAR, ChinaHungaryIBRD onlyIcelandIDA & IBRD totalIDA blendIDA onlyIDA totalIndiaIndonesiaIran, Islamic Rep.IraqIrelandIsraelItalyJamaicaJapanJordanKazakhstanKenyaKorea, Dem. People’s Rep.Korea, Rep.KosovoKuwaitKyrgyz RepublicLate-demographic dividendLatin America & Caribbean Latin America & Caribbean (excluding high income)Latin America & the Caribbean (IDA & IBRD countries)LatviaLeast developed countries: UN classificationLebanonLibyaLithuaniaLow & middle incomeLow incomeLower middle incomeLuxembourgMacedonia, FYRMalaysiaMaltaMauritiusMexicoMiddle East & North AfricaMiddle East & North Africa (excluding high income)Middle East & North Africa (IDA & IBRD countries)Middle incomeMoldovaMongoliaMontenegroMoroccoMozambiqueMyanmarNamibiaNepalNetherlandsNew ZealandNicaraguaNigerNigeriaNorth AmericaNorwayOECD membersOmanOther small statesPakistanPanamaParaguayPeruPhilippinesPolandPortugalPost-demographic dividendPre-demographic dividendQatarRomaniaRussian FederationSaudi ArabiaSenegalSerbiaSingaporeSlovak RepublicSloveniaSmall statesSouth AfricaSouth AsiaSouth Asia (IDA & IBRD)South SudanSpainSri LankaSub-Saharan Africa Sub-Saharan Africa (excluding high income)Sub-Saharan Africa (IDA & IBRD countries)SudanSwedenSwitzerlandSyrian Arab RepublicTajikistanTanzaniaThailandTogoTrinidad and TobagoTunisiaTurkeyTurkmenistanUkraineUnited Arab EmiratesUnited KingdomUnited StatesUpper middle incomeUruguayUzbekistanVenezuela, RBVietnamWorldYemen, Rep.ZambiaZimbabwe línea de tiempo (timeline):
En esta escala de tiempo se presenta un gráfico de 1972 y 2014 de Romania. Los datos de 1971 están ausentes. El número de observaciones reales por fecha: 43.
Fuente (nombre):
Indicadores del desarrollo mundial
Fuente (organización):
IEA Statistics © OECD/IEA 2014 (http://www.iea.org/stats/index.asp), subject to https://www.iea.org/t&c/termsandconditions/
Categorías:
Energy & Mining
Se ha actualizado:
23 abr 2017 año
Los indicadores de los cambios de valor en los últimos años
Mínimo:
0.918
1 ene 1972 año
Máximo:
14.977
1 ene 2014 año
A la fecha de observación
Valor
Cambio absoluto
El cambio con respecto al valor anterior
1 ene 1972 año
0.918
+0.918
0.0%
1 ene 1973 año
1.434
+0.516
56.28%
1 ene 1974 año
1.357
-0.077
-5.39%
1 ene 1975 año
1.517
+0.16
11.77%
1 ene 1976 año
1.554
+0.038
2.47%
1 ene 1977 año
1.247
-0.307
-19.76%
1 ene 1978 año
1.35
+0.103
8.3%
1 ene 1979 año
1.423
+0.073
5.41%
1 ene 1980 año
1.532
+0.108
7.59%
1 ene 1981 año
1.666
+0.135
8.79%
1 ene 1982 año
1.692
+0.025
1.53%
1 ene 1983 año
1.574
-0.118
-6.96%
1 ene 1984 año
1.322
-0.252
-15.99%
1 ene 1985 año
1.505
+0.183
13.81%
1 ene 1986 año
1.684
+0.179
11.88%
1 ene 1987 año
1.394
-0.289
-17.19%
1 ene 1988 año
1.387
-0.007
-0.48%
1 ene 1989 año
1.817
+0.429
30.94%
1 ene 1990 año
1.7
-0.116
-6.41%
1 ene 1991 año
1.576
-0.124
-7.29%
1 ene 1992 año
2.444
+0.868
55.04%
1 ene 1993 año
2.15
-0.294
-12.02%
1 ene 1994 año
2.407
+0.257
11.96%
1 ene 1995 año
2.608
+0.201
8.33%
1 ene 1996 año
3.081
+0.473
18.15%
1 ene 1997 año
3.596
+0.515
16.71%
1 ene 1998 año
6.49
+2.894
80.48%
1 ene 1999 año
7.326
+0.835
12.87%
1 ene 2000 año
8.094
+0.768
10.48%
1 ene 2001 año
7.451
-0.642
-7.94%
1 ene 2002 año
7.355
-0.097
-1.3%
1 ene 2003 año
7.431
+0.076
1.04%
1 ene 2004 año
6.164
-1.266
-17.04%
1 ene 2005 año
7.443
+1.278
20.74%
1 ene 2006 año
8.3
+0.857
11.51%
1 ene 2007 año
7.672
-0.628
-7.57%
1 ene 2008 año
8.556
+0.884
11.52%
1 ene 2009 año
11.182
+2.627
30.7%
1 ene 2010 año
12.681
+1.498
13.4%
1 ene 2011 año
13.67
+0.989
7.8%
1 ene 2012 año
12.488
-1.182
-8.64%
1 ene 2013 año
12.242
-0.246
-1.97%
1 ene 2014 año
14.977
+2.735
22.34%
Ranking de los países por los datos estadísticos actuales


Comentarios: