29
/es/
es
AIzaSyAYiBZKx7MnpbEhh9jyipgxe19OcubqV5w
April 1, 2024
44438
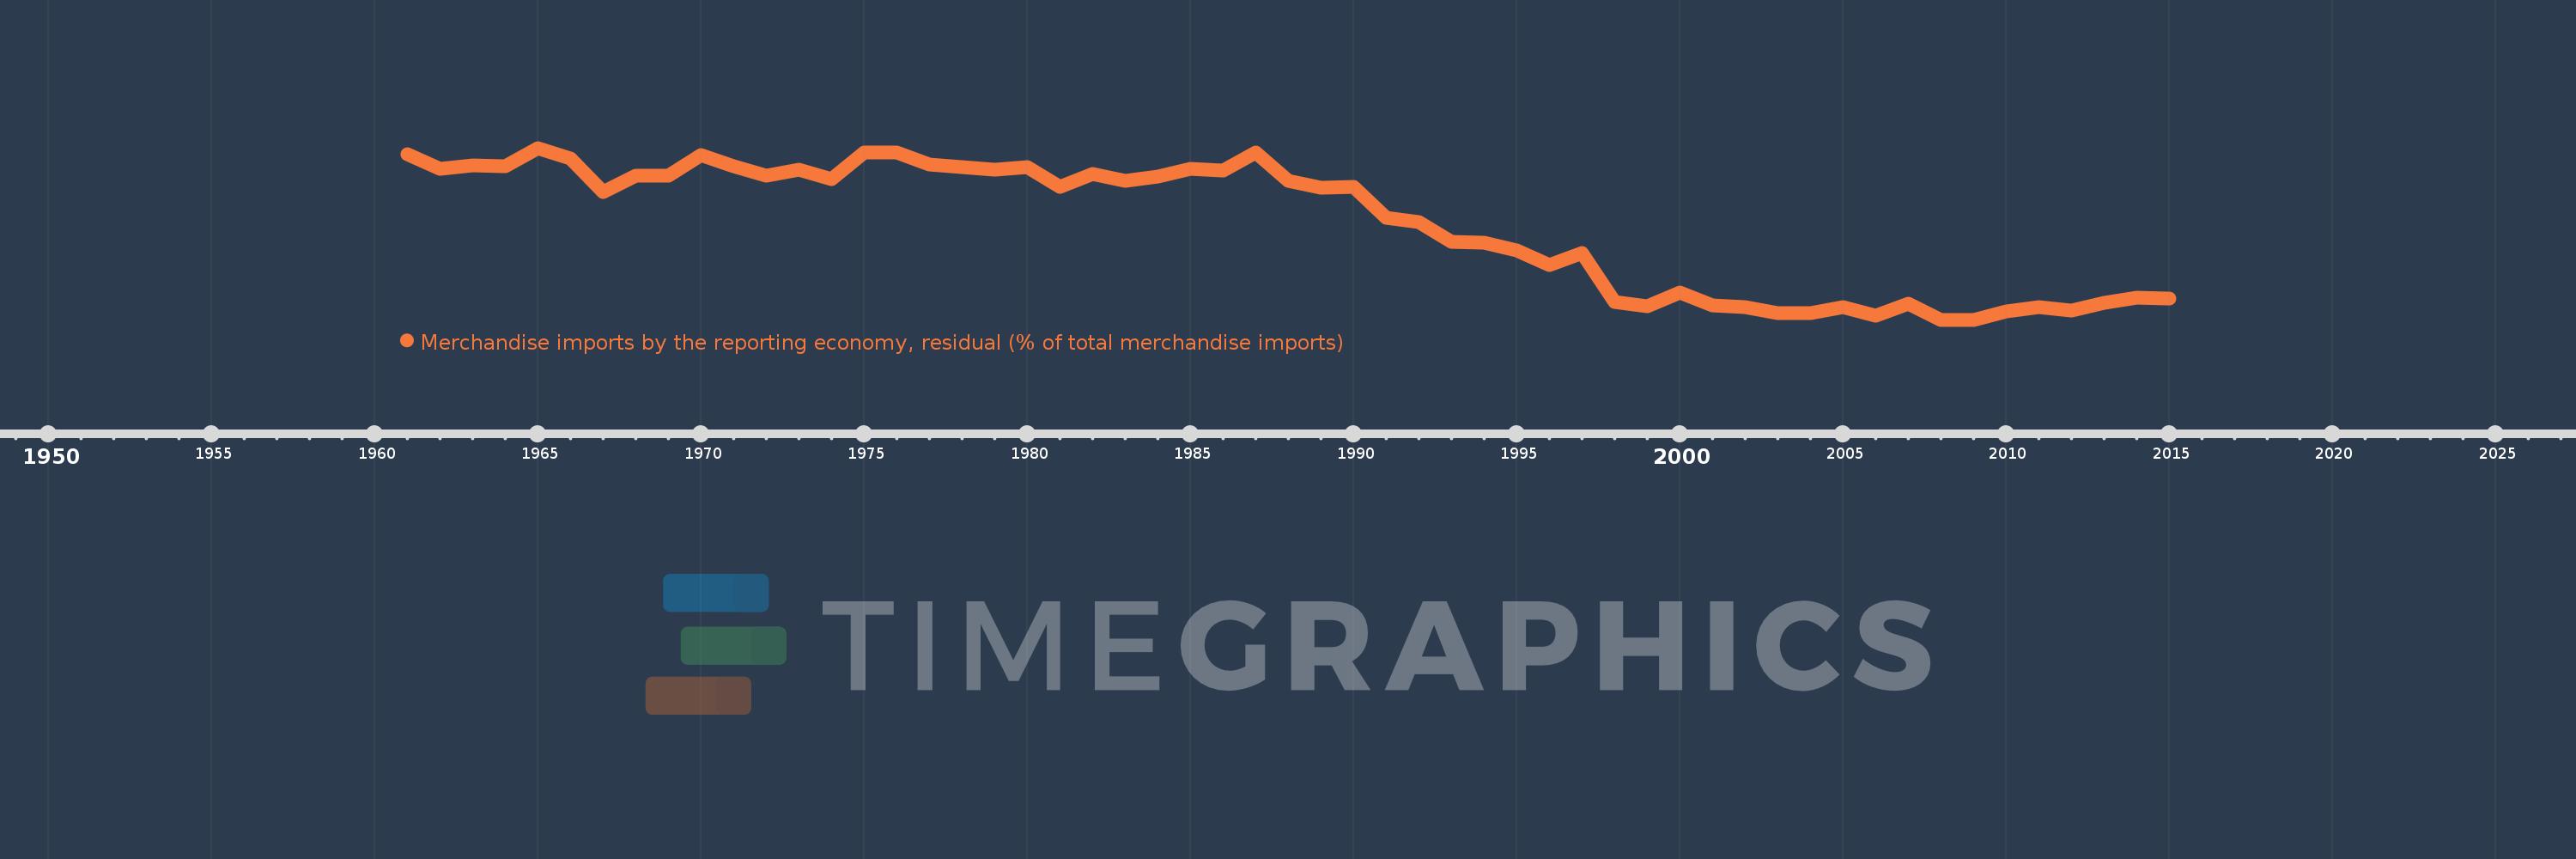
Least developed countries: UN classification
LDC
false
2
1
Merchandise imports by the reporting economy, residual (% of total merchandise imports)
2015,2014,2013,2012,2011,2010,2009,2008,2007,2006,2005,2004,2003,2002,2001,2000,1999,1998,1997,1996,1995,1994,1993,1992,1991,1990,1989,1988,1987,1986,1985,1984,1983,1982,1981,1980,1979,1978,1977,1976,1975,1974,1973,1972,1971,1970,1969,1968,1967,1966,1965,1964,1963,1962,1961
Estas estadísticas en otros países:
AfghanistanAlbaniaAlgeriaAmerican SamoaAngolaAntigua and BarbudaArab WorldArgentinaArmeniaArubaAustraliaAustriaAzerbaijanBahamas, TheBahrainBangladeshBarbadosBelarusBelgiumBelizeBeninBermudaBoliviaBosnia and HerzegovinaBrazilBrunei DarussalamBulgariaBurkina FasoBurundiCabo VerdeCambodiaCameroonCanadaCaribbean small statesCentral African RepublicCentral Europe and the BalticsChadChileChinaColombiaComorosCongo, Dem. Rep.Congo, Rep.Costa RicaCote d'IvoireCroatiaCubaCyprusCzech RepublicDenmarkDjiboutiDominicaDominican RepublicEarly-demographic dividendEast Asia & PacificEast Asia & Pacific (excluding high income)East Asia & Pacific (IDA & IBRD countries)EcuadorEgypt, Arab Rep.El SalvadorEquatorial GuineaEstoniaEthiopiaEuro areaEurope & Central AsiaEurope & Central Asia (excluding high income)Europe & Central Asia (IDA & IBRD countries)European UnionFaroe IslandsFijiFinlandFragile and conflict affected situationsFranceFrench PolynesiaGabonGambia, TheGeorgiaGermanyGhanaGibraltarGreeceGreenlandGrenadaGuamGuatemalaGuineaGuinea-BissauGuyanaHaitiHeavily indebted poor countries (HIPC)High incomeHondurasHong Kong SAR, ChinaHungaryIBRD onlyIcelandIDA & IBRD totalIDA blendIDA onlyIDA totalIndiaIndonesiaIran, Islamic Rep.IraqIrelandIsraelItalyJamaicaJapanJordanKazakhstanKenyaKiribatiKorea, Dem. People’s Rep.Korea, Rep.KosovoKuwaitKyrgyz RepublicLao PDRLate-demographic dividendLatin America & Caribbean Latin America & Caribbean (excluding high income)Latin America & the Caribbean (IDA & IBRD countries)LatviaLeast developed countries: UN classificationLebanonLiberiaLibyaLithuaniaLow & middle incomeLow incomeLower middle incomeLuxembourgMacao SAR, ChinaMacedonia, FYRMadagascarMalawiMalaysiaMaldivesMaliMaltaMauritaniaMauritiusMexicoMiddle East & North AfricaMiddle East & North Africa (excluding high income)Middle East & North Africa (IDA & IBRD countries)Middle incomeMoldovaMongoliaMontenegroMoroccoMozambiqueMyanmarNauruNepalNetherlandsNew CaledoniaNew ZealandNicaraguaNigerNigeriaNorth AmericaNorwayOECD membersOmanOther small statesPacific island small statesPakistanPanamaPapua New GuineaParaguayPeruPhilippinesPolandPortugalPost-demographic dividendPre-demographic dividendQatarRomaniaRussian FederationRwandaSamoaSao Tome and PrincipeSaudi ArabiaSenegalSerbiaSeychellesSierra LeoneSingaporeSlovak RepublicSloveniaSmall statesSolomon IslandsSomaliaSouth AfricaSouth AsiaSouth Asia (IDA & IBRD)SpainSri LankaSt. Kitts and NevisSt. LuciaSt. Vincent and the GrenadinesSub-Saharan Africa Sub-Saharan Africa (excluding high income)Sub-Saharan Africa (IDA & IBRD countries)SudanSurinameSwedenSwitzerlandSyrian Arab RepublicTajikistanTanzaniaThailandTogoTongaTrinidad and TobagoTunisiaTurkeyTurkmenistanTuvaluUgandaUkraineUnited Arab EmiratesUnited KingdomUnited StatesUpper middle incomeUruguayUzbekistanVanuatuVenezuela, RBVietnamWorldYemen, Rep.ZambiaZimbabwe línea de tiempo (timeline):
En esta escala de tiempo se presenta un gráfico de 1961 y 2015 de Least developed countries: UN classification. Los datos de 1960 están ausentes. El número de observaciones reales por fecha: 55.
Fuente (nombre):
Indicadores del desarrollo mundial
Fuente (organización):
World Bank staff estimates based data from International Monetary Fund's Direction of Trade database.
Categorías:
Private Sector, Trade
Se ha actualizado:
23 abr 2017 año
Los indicadores de los cambios de valor en los últimos años
Mínimo:
6.317
1 ene 2009 año
Máximo:
23.766
1 ene 1965 año
A la fecha de observación
Valor
Cambio absoluto
El cambio con respecto al valor anterior
1 ene 1961 año
23.119
+23.119
0.0%
1 ene 1962 año
21.62
-1.5
-6.49%
1 ene 1963 año
21.971
+0.352
1.63%
1 ene 1964 año
21.941
-0.031
-0.14%
1 ene 1965 año
23.766
+1.825
8.32%
1 ene 1966 año
22.713
-1.052
-4.43%
1 ene 1967 año
19.301
-3.413
-15.02%
1 ene 1968 año
20.976
+1.675
8.68%
1 ene 1969 año
20.948
-0.027
-0.13%
1 ene 1970 año
23.007
+2.059
9.83%
1 ene 1971 año
21.923
-1.084
-4.71%
1 ene 1972 año
20.952
-0.971
-4.43%
1 ene 1973 año
21.548
+0.596
2.84%
1 ene 1974 año
20.569
-0.979
-4.54%
1 ene 1975 año
23.271
+2.702
13.14%
1 ene 1976 año
23.325
+0.054
0.23%
1 ene 1977 año
22.05
-1.274
-5.46%
1 ene 1978 año
21.863
-0.188
-0.85%
1 ene 1979 año
21.551
-0.312
-1.43%
1 ene 1980 año
21.782
+0.231
1.07%
1 ene 1981 año
19.857
-1.925
-8.84%
1 ene 1982 año
21.105
+1.248
6.28%
1 ene 1983 año
20.461
-0.644
-3.05%
1 ene 1984 año
20.836
+0.374
1.83%
1 ene 1985 año
21.66
+0.824
3.96%
1 ene 1986 año
21.44
-0.22
-1.01%
1 ene 1987 año
23.282
+1.842
8.59%
1 ene 1988 año
20.468
-2.814
-12.09%
1 ene 1989 año
19.684
-0.784
-3.83%
1 ene 1990 año
19.776
+0.092
0.47%
1 ene 1991 año
16.674
-3.102
-15.68%
1 ene 1992 año
16.242
-0.432
-2.59%
1 ene 1993 año
14.225
-2.017
-12.42%
1 ene 1994 año
14.117
-0.108
-0.76%
1 ene 1995 año
13.341
-0.776
-5.5%
1 ene 1996 año
11.85
-1.491
-11.17%
1 ene 1997 año
13.137
+1.287
10.86%
1 ene 1998 año
8.129
-5.009
-38.13%
1 ene 1999 año
7.699
-0.429
-5.28%
1 ene 2000 año
9.04
+1.34
17.41%
1 ene 2001 año
7.784
-1.255
-13.89%
1 ene 2002 año
7.605
-0.179
-2.3%
1 ene 2003 año
6.977
-0.628
-8.26%
1 ene 2004 año
6.969
-0.008
-0.11%
1 ene 2005 año
7.618
+0.649
9.32%
1 ene 2006 año
6.723
-0.895
-11.75%
1 ene 2007 año
7.974
+1.251
18.61%
1 ene 2008 año
6.334
-1.64
-20.57%
1 ene 2009 año
6.317
-0.017
-0.26%
1 ene 2010 año
7.184
+0.867
13.72%
1 ene 2011 año
7.616
+0.432
6.01%
1 ene 2012 año
7.238
-0.378
-4.96%
1 ene 2013 año
8.077
+0.839
11.6%
1 ene 2014 año
8.59
+0.513
6.35%
1 ene 2015 año
8.495
-0.096
-1.11%
Ranking de los países por los datos estadísticos actuales


Comentarios: