29
/es/
es
AIzaSyAYiBZKx7MnpbEhh9jyipgxe19OcubqV5w
April 1, 2024
121168
Dominica
DMA
true
2
1
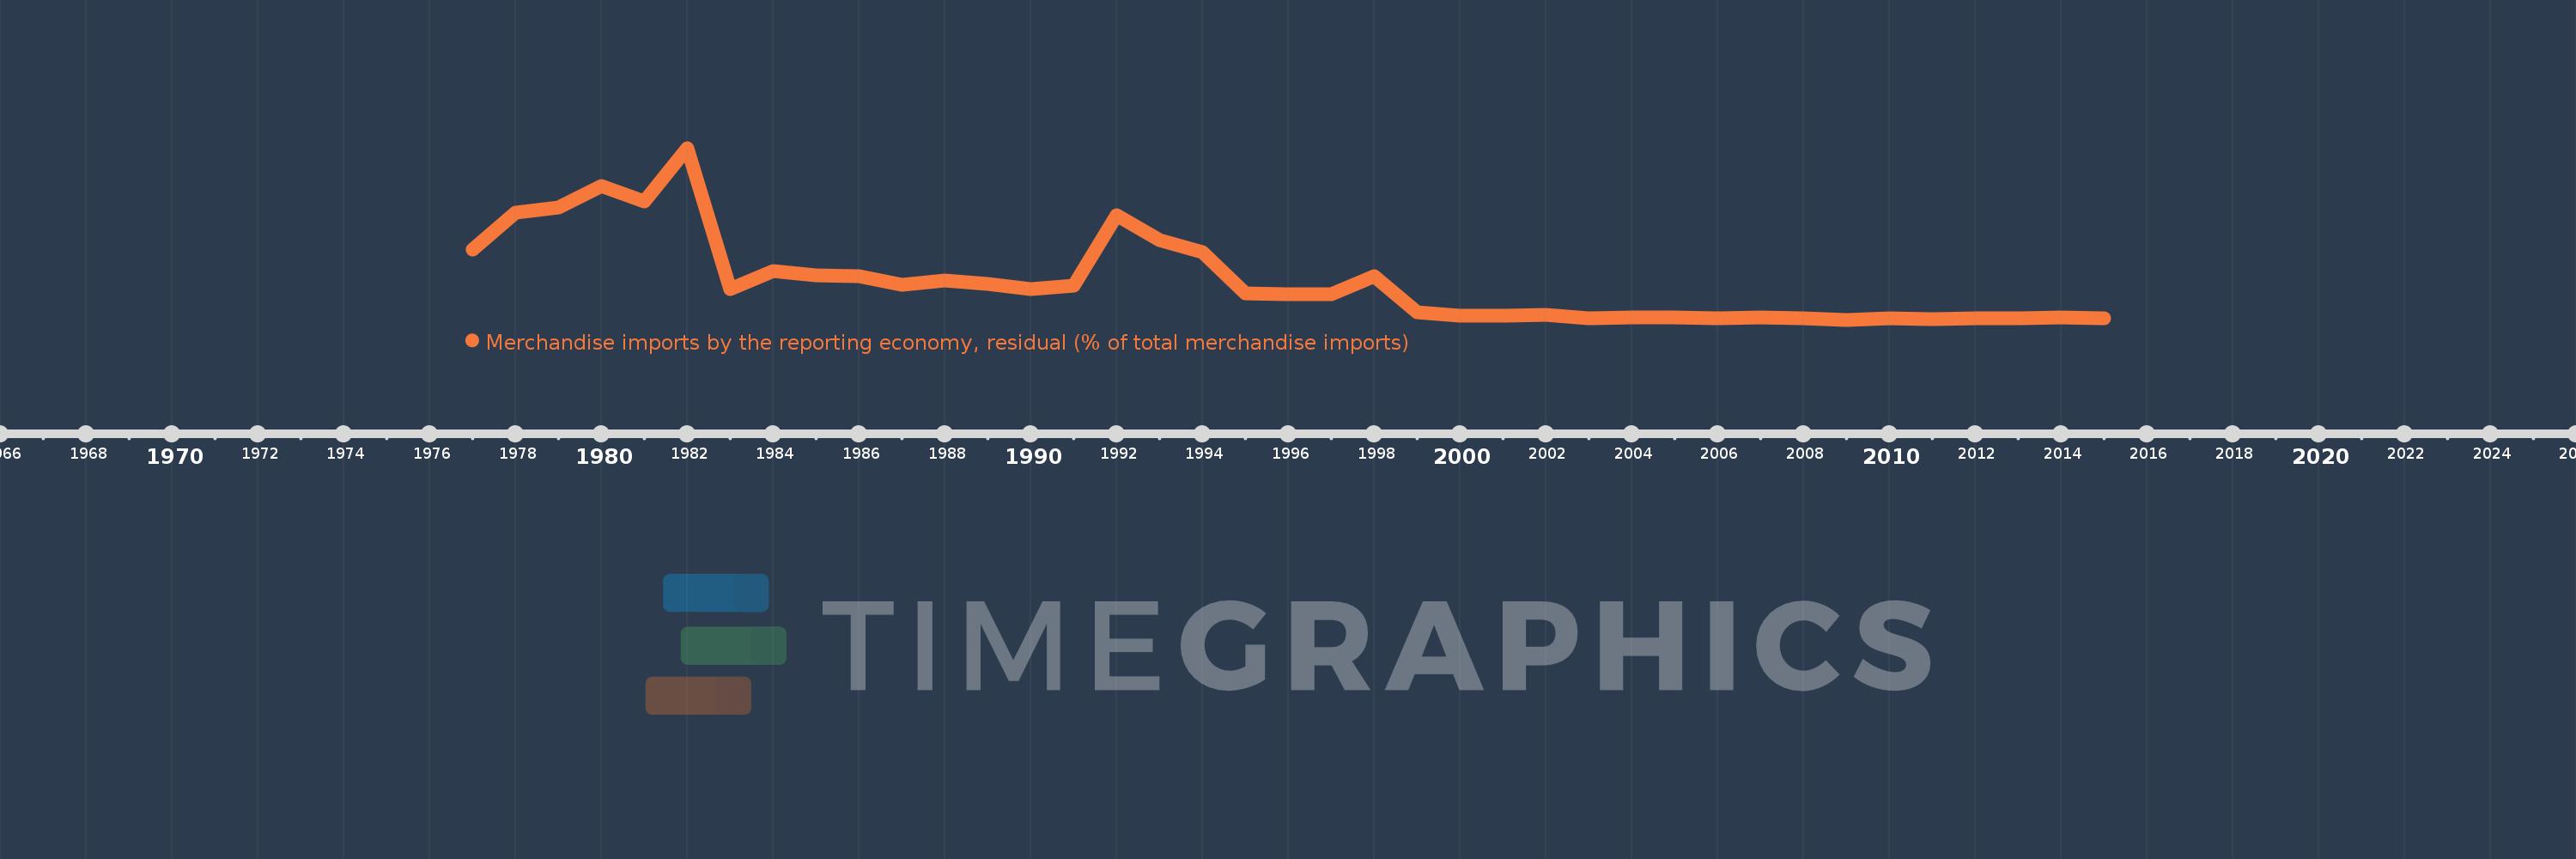
Merchandise imports by the reporting economy, residual (% of total merchandise imports)
2015,2014,2013,2012,2011,2010,2009,2008,2007,2006,2005,2004,2003,2002,2001,2000,1999,1998,1997,1996,1995,1994,1993,1992,1991,1990,1989,1988,1987,1986,1985,1984,1983,1982,1981,1980,1979,1978,1977
Estas estadísticas en otros países:
AfghanistanAlbaniaAlgeriaAmerican SamoaAngolaAntigua and BarbudaArab WorldArgentinaArmeniaArubaAustraliaAustriaAzerbaijanBahamas, TheBahrainBangladeshBarbadosBelarusBelgiumBelizeBeninBermudaBoliviaBosnia and HerzegovinaBrazilBrunei DarussalamBulgariaBurkina FasoBurundiCabo VerdeCambodiaCameroonCanadaCaribbean small statesCentral African RepublicCentral Europe and the BalticsChadChileChinaColombiaComorosCongo, Dem. Rep.Congo, Rep.Costa RicaCote d'IvoireCroatiaCubaCyprusCzech RepublicDenmarkDjiboutiDominicaDominican RepublicEarly-demographic dividendEast Asia & PacificEast Asia & Pacific (excluding high income)East Asia & Pacific (IDA & IBRD countries)EcuadorEgypt, Arab Rep.El SalvadorEquatorial GuineaEstoniaEthiopiaEuro areaEurope & Central AsiaEurope & Central Asia (excluding high income)Europe & Central Asia (IDA & IBRD countries)European UnionFaroe IslandsFijiFinlandFragile and conflict affected situationsFranceFrench PolynesiaGabonGambia, TheGeorgiaGermanyGhanaGibraltarGreeceGreenlandGrenadaGuamGuatemalaGuineaGuinea-BissauGuyanaHaitiHeavily indebted poor countries (HIPC)High incomeHondurasHong Kong SAR, ChinaHungaryIBRD onlyIcelandIDA & IBRD totalIDA blendIDA onlyIDA totalIndiaIndonesiaIran, Islamic Rep.IraqIrelandIsraelItalyJamaicaJapanJordanKazakhstanKenyaKiribatiKorea, Dem. People’s Rep.Korea, Rep.KosovoKuwaitKyrgyz RepublicLao PDRLate-demographic dividendLatin America & Caribbean Latin America & Caribbean (excluding high income)Latin America & the Caribbean (IDA & IBRD countries)LatviaLeast developed countries: UN classificationLebanonLiberiaLibyaLithuaniaLow & middle incomeLow incomeLower middle incomeLuxembourgMacao SAR, ChinaMacedonia, FYRMadagascarMalawiMalaysiaMaldivesMaliMaltaMauritaniaMauritiusMexicoMiddle East & North AfricaMiddle East & North Africa (excluding high income)Middle East & North Africa (IDA & IBRD countries)Middle incomeMoldovaMongoliaMontenegroMoroccoMozambiqueMyanmarNauruNepalNetherlandsNew CaledoniaNew ZealandNicaraguaNigerNigeriaNorth AmericaNorwayOECD membersOmanOther small statesPacific island small statesPakistanPanamaPapua New GuineaParaguayPeruPhilippinesPolandPortugalPost-demographic dividendPre-demographic dividendQatarRomaniaRussian FederationRwandaSamoaSao Tome and PrincipeSaudi ArabiaSenegalSerbiaSeychellesSierra LeoneSingaporeSlovak RepublicSloveniaSmall statesSolomon IslandsSomaliaSouth AfricaSouth AsiaSouth Asia (IDA & IBRD)SpainSri LankaSt. Kitts and NevisSt. LuciaSt. Vincent and the GrenadinesSub-Saharan Africa Sub-Saharan Africa (excluding high income)Sub-Saharan Africa (IDA & IBRD countries)SudanSurinameSwedenSwitzerlandSyrian Arab RepublicTajikistanTanzaniaThailandTogoTongaTrinidad and TobagoTunisiaTurkeyTurkmenistanTuvaluUgandaUkraineUnited Arab EmiratesUnited KingdomUnited StatesUpper middle incomeUruguayUzbekistanVanuatuVenezuela, RBVietnamWorldYemen, Rep.ZambiaZimbabwe línea de tiempo (timeline):
En esta escala de tiempo se presenta un gráfico de 1977 y 2015 de Dominica. Los datos de 1976 están ausentes. El número de observaciones reales por fecha: 39.
Fuente (nombre):
Indicadores del desarrollo mundial
Fuente (organización):
World Bank staff estimates based data from International Monetary Fund's Direction of Trade database.
Categorías:
Private Sector, Trade
Se ha actualizado:
23 abr 2017 año
Los indicadores de los cambios de valor en los últimos años
Mínimo:
0.426
1 ene 2009 año
Máximo:
29.472
1 ene 1982 año
A la fecha de observación
Valor
Cambio absoluto
El cambio con respecto al valor anterior
1 ene 1977 año
12.246
+12.246
0.0%
1 ene 1978 año
18.575
+6.329
51.69%
1 ene 1979 año
19.392
+0.817
4.4%
1 ene 1980 año
23.017
+3.624
18.69%
1 ene 1981 año
20.451
-2.566
-11.15%
1 ene 1982 año
29.472
+9.021
44.11%
1 ene 1983 año
5.641
-23.831
-80.86%
1 ene 1984 año
8.657
+3.017
53.48%
1 ene 1985 año
7.982
-0.675
-7.8%
1 ene 1986 año
7.763
-0.219
-2.75%
1 ene 1987 año
6.365
-1.398
-18.01%
1 ene 1988 año
7.057
+0.692
10.88%
1 ene 1989 año
6.547
-0.51
-7.23%
1 ene 1990 año
5.641
-0.906
-13.84%
1 ene 1991 año
6.261
+0.619
10.98%
1 ene 1992 año
18.095
+11.835
189.04%
1 ene 1993 año
13.868
-4.227
-23.36%
1 ene 1994 año
11.855
-2.013
-14.52%
1 ene 1995 año
4.925
-6.93
-58.46%
1 ene 1996 año
4.778
-0.147
-2.98%
1 ene 1997 año
4.725
-0.053
-1.12%
1 ene 1998 año
7.812
+3.088
65.35%
1 ene 1999 año
1.706
-6.106
-78.16%
1 ene 2000 año
1.119
-0.587
-34.42%
1 ene 2001 año
1.148
+0.029
2.56%
1 ene 2002 año
1.258
+0.111
9.63%
1 ene 2003 año
0.686
-0.572
-45.47%
1 ene 2004 año
0.758
+0.072
10.46%
1 ene 2005 año
0.78
+0.022
2.92%
1 ene 2006 año
0.722
-0.058
-7.4%
1 ene 2007 año
0.751
+0.028
3.9%
1 ene 2008 año
0.692
-0.058
-7.76%
1 ene 2009 año
0.426
-0.267
-38.53%
1 ene 2010 año
0.685
+0.259
60.93%
1 ene 2011 año
0.564
-0.121
-17.6%
1 ene 2012 año
0.681
+0.117
20.7%
1 ene 2013 año
0.679
-0.002
-0.29%
1 ene 2014 año
0.783
+0.104
15.29%
1 ene 2015 año
0.736
-0.048
-6.07%
Ranking de los países por los datos estadísticos actuales


Comentarios: