29
/es/
es
AIzaSyAYiBZKx7MnpbEhh9jyipgxe19OcubqV5w
April 1, 2024
174381
Lao PDR
LAO
true
2
1
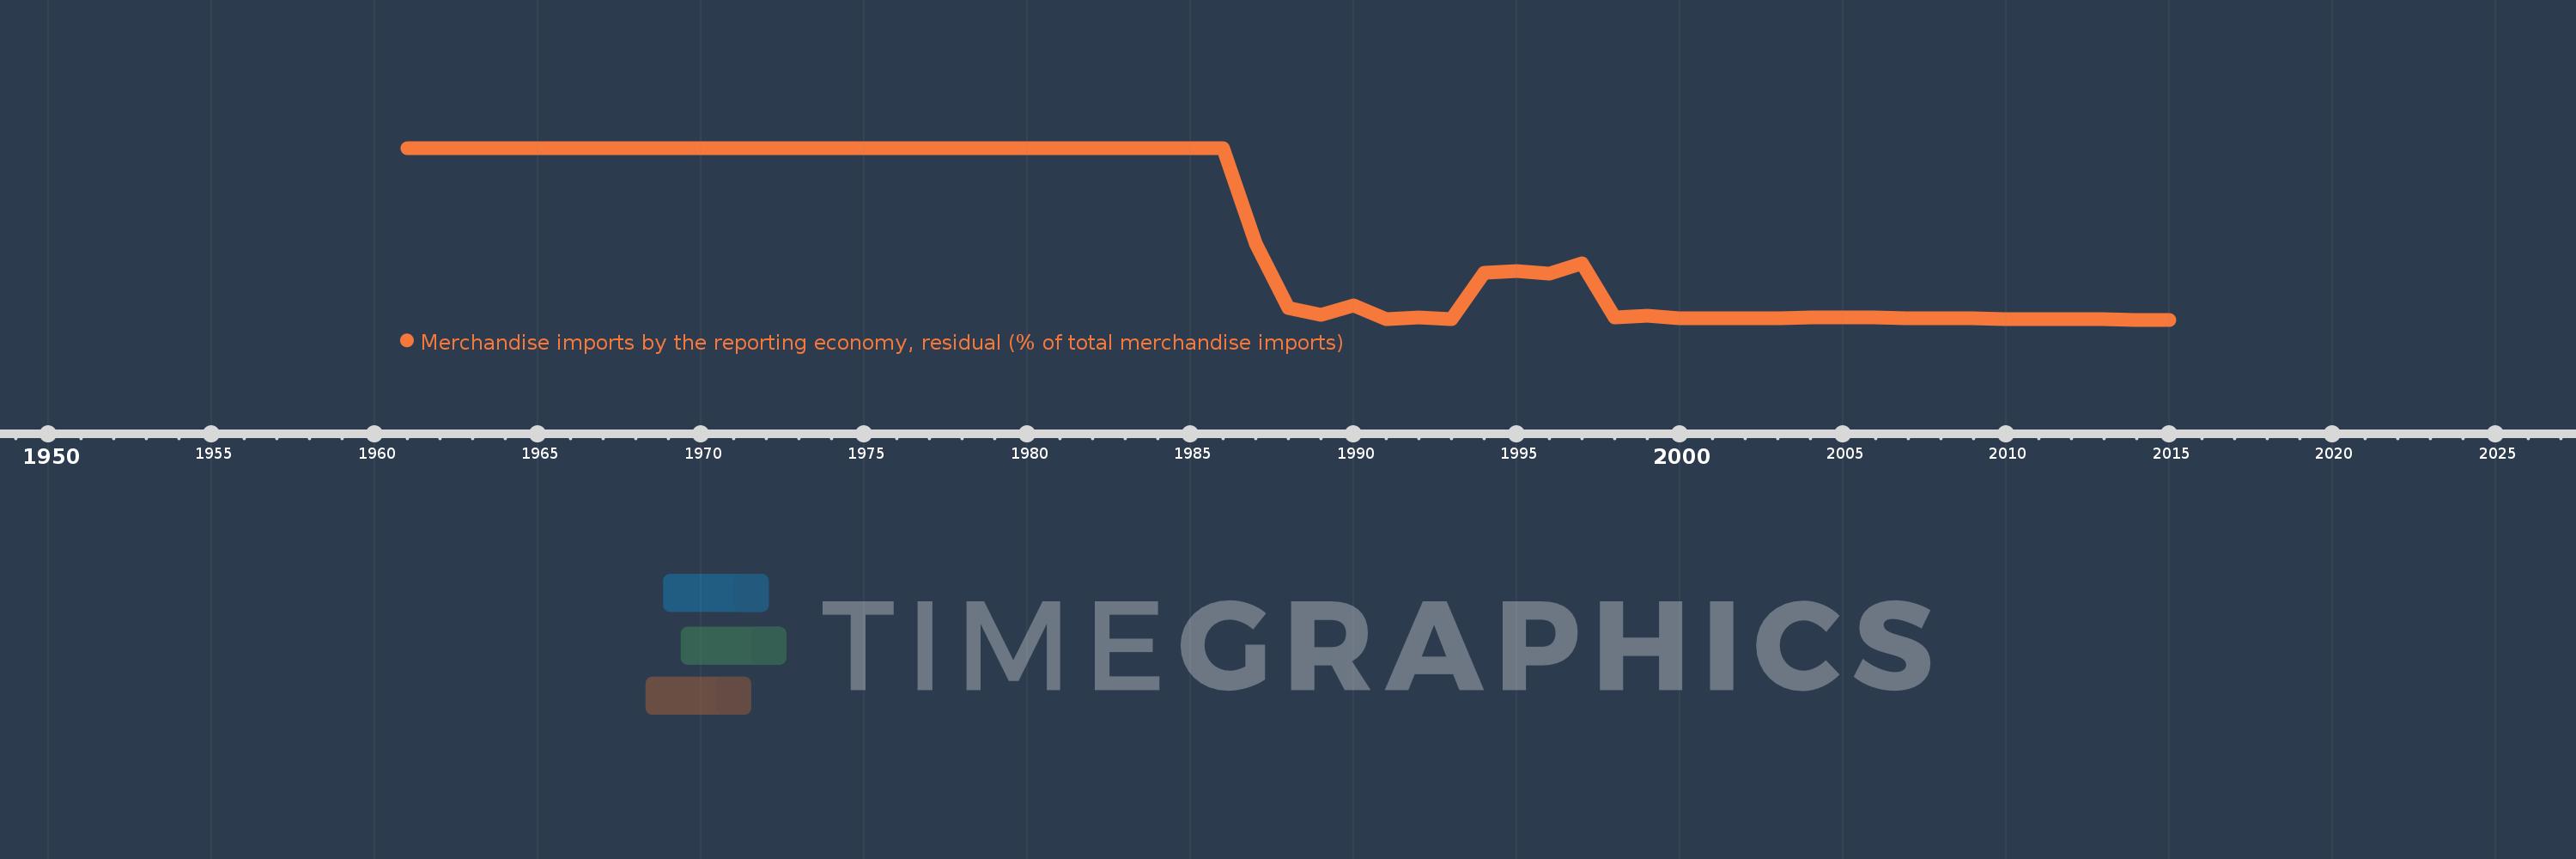
Merchandise imports by the reporting economy, residual (% of total merchandise imports)
2015,2014,2013,2012,2011,2010,2009,2008,2007,2006,2005,2004,2003,2002,2001,2000,1999,1998,1997,1996,1995,1994,1993,1992,1991,1990,1989,1988,1987,1986,1985,1984,1983,1982,1975,1974,1973,1972,1971,1970,1969,1968,1966,1965,1964,1963,1962,1961
Estas estadísticas en otros países:
AfghanistanAlbaniaAlgeriaAmerican SamoaAngolaAntigua and BarbudaArab WorldArgentinaArmeniaArubaAustraliaAustriaAzerbaijanBahamas, TheBahrainBangladeshBarbadosBelarusBelgiumBelizeBeninBermudaBoliviaBosnia and HerzegovinaBrazilBrunei DarussalamBulgariaBurkina FasoBurundiCabo VerdeCambodiaCameroonCanadaCaribbean small statesCentral African RepublicCentral Europe and the BalticsChadChileChinaColombiaComorosCongo, Dem. Rep.Congo, Rep.Costa RicaCote d'IvoireCroatiaCubaCyprusCzech RepublicDenmarkDjiboutiDominicaDominican RepublicEarly-demographic dividendEast Asia & PacificEast Asia & Pacific (excluding high income)East Asia & Pacific (IDA & IBRD countries)EcuadorEgypt, Arab Rep.El SalvadorEquatorial GuineaEstoniaEthiopiaEuro areaEurope & Central AsiaEurope & Central Asia (excluding high income)Europe & Central Asia (IDA & IBRD countries)European UnionFaroe IslandsFijiFinlandFragile and conflict affected situationsFranceFrench PolynesiaGabonGambia, TheGeorgiaGermanyGhanaGibraltarGreeceGreenlandGrenadaGuamGuatemalaGuineaGuinea-BissauGuyanaHaitiHeavily indebted poor countries (HIPC)High incomeHondurasHong Kong SAR, ChinaHungaryIBRD onlyIcelandIDA & IBRD totalIDA blendIDA onlyIDA totalIndiaIndonesiaIran, Islamic Rep.IraqIrelandIsraelItalyJamaicaJapanJordanKazakhstanKenyaKiribatiKorea, Dem. People’s Rep.Korea, Rep.KosovoKuwaitKyrgyz RepublicLao PDRLate-demographic dividendLatin America & Caribbean Latin America & Caribbean (excluding high income)Latin America & the Caribbean (IDA & IBRD countries)LatviaLeast developed countries: UN classificationLebanonLiberiaLibyaLithuaniaLow & middle incomeLow incomeLower middle incomeLuxembourgMacao SAR, ChinaMacedonia, FYRMadagascarMalawiMalaysiaMaldivesMaliMaltaMauritaniaMauritiusMexicoMiddle East & North AfricaMiddle East & North Africa (excluding high income)Middle East & North Africa (IDA & IBRD countries)Middle incomeMoldovaMongoliaMontenegroMoroccoMozambiqueMyanmarNauruNepalNetherlandsNew CaledoniaNew ZealandNicaraguaNigerNigeriaNorth AmericaNorwayOECD membersOmanOther small statesPacific island small statesPakistanPanamaPapua New GuineaParaguayPeruPhilippinesPolandPortugalPost-demographic dividendPre-demographic dividendQatarRomaniaRussian FederationRwandaSamoaSao Tome and PrincipeSaudi ArabiaSenegalSerbiaSeychellesSierra LeoneSingaporeSlovak RepublicSloveniaSmall statesSolomon IslandsSomaliaSouth AfricaSouth AsiaSouth Asia (IDA & IBRD)SpainSri LankaSt. Kitts and NevisSt. LuciaSt. Vincent and the GrenadinesSub-Saharan Africa Sub-Saharan Africa (excluding high income)Sub-Saharan Africa (IDA & IBRD countries)SudanSurinameSwedenSwitzerlandSyrian Arab RepublicTajikistanTanzaniaThailandTogoTongaTrinidad and TobagoTunisiaTurkeyTurkmenistanTuvaluUgandaUkraineUnited Arab EmiratesUnited KingdomUnited StatesUpper middle incomeUruguayUzbekistanVanuatuVenezuela, RBVietnamWorldYemen, Rep.ZambiaZimbabwe línea de tiempo (timeline):
En esta escala de tiempo se presenta un gráfico de 1961 y 2015 de Lao PDR. Los datos de 1960 están ausentes. El número de observaciones reales por fecha: 48.
Fuente (nombre):
Indicadores del desarrollo mundial
Fuente (organización):
World Bank staff estimates based data from International Monetary Fund's Direction of Trade database.
Categorías:
Private Sector, Trade
Se ha actualizado:
23 abr 2017 año
Los indicadores de los cambios de valor en los últimos años
Mínimo:
0.774
1 ene 2015 año
Máximo:
100.0
1 ene 1961 año
A la fecha de observación
Valor
Cambio absoluto
El cambio con respecto al valor anterior
1 ene 1961 año
100.0
+100.0
0.0%
1 ene 1962 año
100.0
0.0
0.0%
1 ene 1963 año
100.0
0.0
0.0%
1 ene 1964 año
100.0
0.0
0.0%
1 ene 1965 año
100.0
0.0
0.0%
1 ene 1966 año
100.0
0.0
0.0%
1 ene 1968 año
100.0
0.0
0.0%
1 ene 1969 año
100.0
0.0
0.0%
1 ene 1970 año
100.0
0.0
0.0%
1 ene 1971 año
100.0
0.0
0.0%
1 ene 1972 año
100.0
0.0
0.0%
1 ene 1973 año
100.0
0.0
0.0%
1 ene 1974 año
100.0
0.0
0.0%
1 ene 1975 año
100.0
0.0
0.0%
1 ene 1982 año
100.0
0.0
0.0%
1 ene 1983 año
100.0
0.0
0.0%
1 ene 1984 año
100.0
0.0
0.0%
1 ene 1985 año
100.0
0.0
0.0%
1 ene 1986 año
100.0
0.0
0.0%
1 ene 1987 año
44.9
-55.1
-55.1%
1 ene 1988 año
7.533
-37.368
-83.22%
1 ene 1989 año
3.489
-4.044
-53.69%
1 ene 1990 año
9.28
+5.791
166.01%
1 ene 1991 año
1.254
-8.026
-86.48%
1 ene 1992 año
1.907
+0.653
52.06%
1 ene 1993 año
1.031
-0.876
-45.94%
1 ene 1994 año
28.155
+27.124
2.63 mil%
1 ene 1995 año
28.896
+0.741
2.63%
1 ene 1996 año
27.463
-1.433
-4.96%
1 ene 1997 año
33.266
+5.803
21.13%
1 ene 1998 año
1.968
-31.298
-94.08%
1 ene 1999 año
3.323
+1.355
68.83%
1 ene 2000 año
1.521
-1.802
-54.24%
1 ene 2001 año
1.563
+0.042
2.78%
1 ene 2002 año
1.658
+0.096
6.11%
1 ene 2003 año
1.782
+0.123
7.43%
1 ene 2004 año
2.019
+0.237
13.29%
1 ene 2005 año
2.029
+0.011
0.53%
1 ene 2006 año
1.931
-0.098
-4.83%
1 ene 2007 año
1.835
-0.096
-5.0%
1 ene 2008 año
1.786
-0.049
-2.68%
1 ene 2009 año
1.514
-0.271
-15.19%
1 ene 2010 año
1.299
-0.215
-14.2%
1 ene 2011 año
1.335
+0.036
2.77%
1 ene 2012 año
1.153
-0.182
-13.63%
1 ene 2013 año
0.879
-0.274
-23.78%
1 ene 2014 año
0.805
-0.074
-8.37%
1 ene 2015 año
0.774
-0.032
-3.93%
Ranking de los países por los datos estadísticos actuales


Comentarios: