29
/es/
es
AIzaSyAYiBZKx7MnpbEhh9jyipgxe19OcubqV5w
April 1, 2024
101341
Canada
CAN
true
2
1
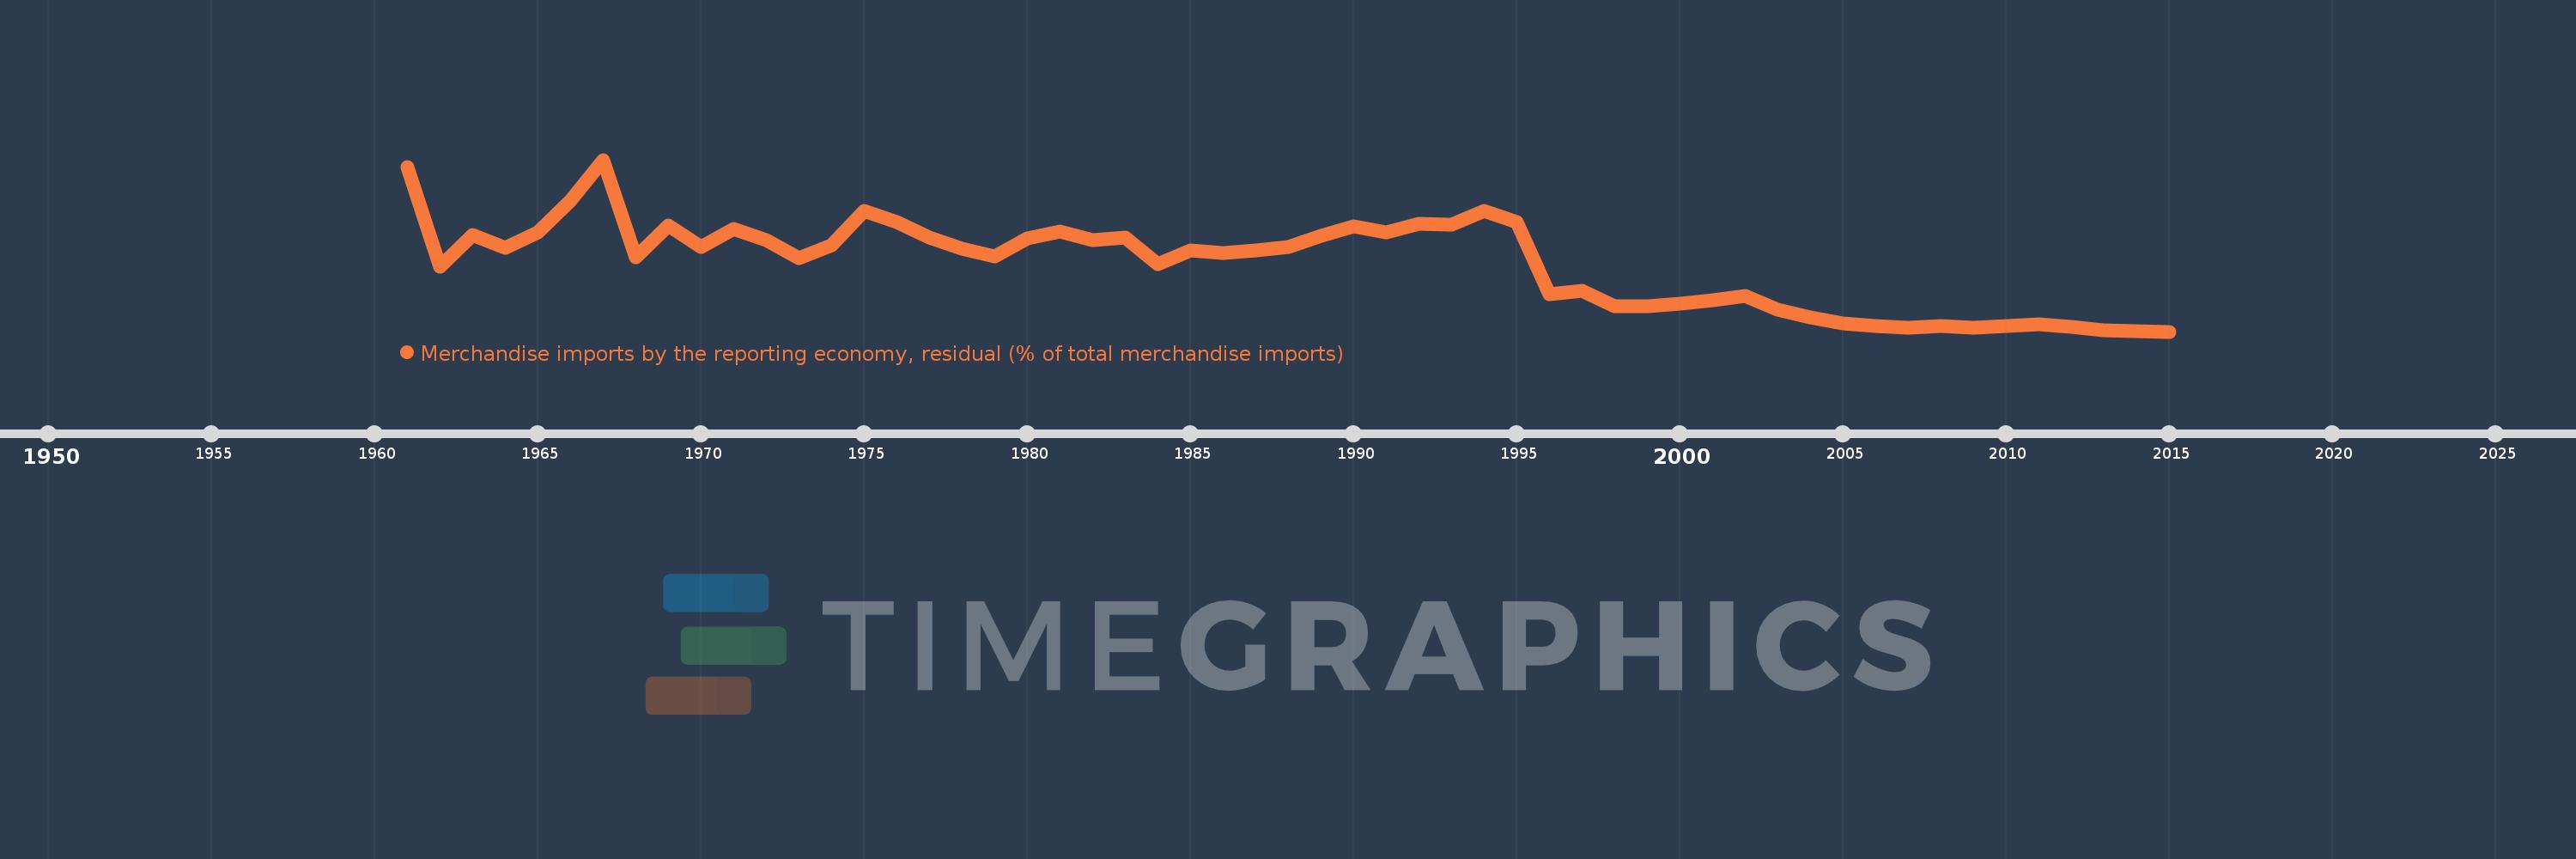
Merchandise imports by the reporting economy, residual (% of total merchandise imports)
2015,2014,2013,2012,2011,2010,2009,2008,2007,2006,2005,2004,2003,2002,2001,2000,1999,1998,1997,1996,1995,1994,1993,1992,1991,1990,1989,1988,1987,1986,1985,1984,1983,1982,1981,1980,1979,1978,1977,1976,1975,1974,1973,1972,1971,1970,1969,1968,1967,1966,1965,1964,1963,1962,1961
Estas estadísticas en otros países:
AfghanistanAlbaniaAlgeriaAmerican SamoaAngolaAntigua and BarbudaArab WorldArgentinaArmeniaArubaAustraliaAustriaAzerbaijanBahamas, TheBahrainBangladeshBarbadosBelarusBelgiumBelizeBeninBermudaBoliviaBosnia and HerzegovinaBrazilBrunei DarussalamBulgariaBurkina FasoBurundiCabo VerdeCambodiaCameroonCanadaCaribbean small statesCentral African RepublicCentral Europe and the BalticsChadChileChinaColombiaComorosCongo, Dem. Rep.Congo, Rep.Costa RicaCote d'IvoireCroatiaCubaCyprusCzech RepublicDenmarkDjiboutiDominicaDominican RepublicEarly-demographic dividendEast Asia & PacificEast Asia & Pacific (excluding high income)East Asia & Pacific (IDA & IBRD countries)EcuadorEgypt, Arab Rep.El SalvadorEquatorial GuineaEstoniaEthiopiaEuro areaEurope & Central AsiaEurope & Central Asia (excluding high income)Europe & Central Asia (IDA & IBRD countries)European UnionFaroe IslandsFijiFinlandFragile and conflict affected situationsFranceFrench PolynesiaGabonGambia, TheGeorgiaGermanyGhanaGibraltarGreeceGreenlandGrenadaGuamGuatemalaGuineaGuinea-BissauGuyanaHaitiHeavily indebted poor countries (HIPC)High incomeHondurasHong Kong SAR, ChinaHungaryIBRD onlyIcelandIDA & IBRD totalIDA blendIDA onlyIDA totalIndiaIndonesiaIran, Islamic Rep.IraqIrelandIsraelItalyJamaicaJapanJordanKazakhstanKenyaKiribatiKorea, Dem. People’s Rep.Korea, Rep.KosovoKuwaitKyrgyz RepublicLao PDRLate-demographic dividendLatin America & Caribbean Latin America & Caribbean (excluding high income)Latin America & the Caribbean (IDA & IBRD countries)LatviaLeast developed countries: UN classificationLebanonLiberiaLibyaLithuaniaLow & middle incomeLow incomeLower middle incomeLuxembourgMacao SAR, ChinaMacedonia, FYRMadagascarMalawiMalaysiaMaldivesMaliMaltaMauritaniaMauritiusMexicoMiddle East & North AfricaMiddle East & North Africa (excluding high income)Middle East & North Africa (IDA & IBRD countries)Middle incomeMoldovaMongoliaMontenegroMoroccoMozambiqueMyanmarNauruNepalNetherlandsNew CaledoniaNew ZealandNicaraguaNigerNigeriaNorth AmericaNorwayOECD membersOmanOther small statesPacific island small statesPakistanPanamaPapua New GuineaParaguayPeruPhilippinesPolandPortugalPost-demographic dividendPre-demographic dividendQatarRomaniaRussian FederationRwandaSamoaSao Tome and PrincipeSaudi ArabiaSenegalSerbiaSeychellesSierra LeoneSingaporeSlovak RepublicSloveniaSmall statesSolomon IslandsSomaliaSouth AfricaSouth AsiaSouth Asia (IDA & IBRD)SpainSri LankaSt. Kitts and NevisSt. LuciaSt. Vincent and the GrenadinesSub-Saharan Africa Sub-Saharan Africa (excluding high income)Sub-Saharan Africa (IDA & IBRD countries)SudanSurinameSwedenSwitzerlandSyrian Arab RepublicTajikistanTanzaniaThailandTogoTongaTrinidad and TobagoTunisiaTurkeyTurkmenistanTuvaluUgandaUkraineUnited Arab EmiratesUnited KingdomUnited StatesUpper middle incomeUruguayUzbekistanVanuatuVenezuela, RBVietnamWorldYemen, Rep.ZambiaZimbabwe línea de tiempo (timeline):
En esta escala de tiempo se presenta un gráfico de 1961 y 2015 de Canada. Los datos de 1960 están ausentes. El número de observaciones reales por fecha: 55.
Fuente (nombre):
Indicadores del desarrollo mundial
Fuente (organización):
World Bank staff estimates based data from International Monetary Fund's Direction of Trade database.
Categorías:
Private Sector, Trade
Se ha actualizado:
23 abr 2017 año
Los indicadores de los cambios de valor en los últimos años
Mínimo:
0.712
1 ene 2015 año
Máximo:
7.386
1 ene 1967 año
A la fecha de observación
Valor
Cambio absoluto
El cambio con respecto al valor anterior
1 ene 1961 año
7.1
+7.1
0.0%
1 ene 1962 año
3.216
-3.883
-54.7%
1 ene 1963 año
4.466
+1.249
38.85%
1 ene 1964 año
3.957
-0.509
-11.4%
1 ene 1965 año
4.557
+0.601
15.18%
1 ene 1966 año
5.804
+1.247
27.36%
1 ene 1967 año
7.386
+1.581
27.24%
1 ene 1968 año
3.611
-3.775
-51.11%
1 ene 1969 año
4.818
+1.208
33.45%
1 ene 1970 año
4.015
-0.804
-16.68%
1 ene 1971 año
4.715
+0.701
17.45%
1 ene 1972 año
4.25
-0.465
-9.87%
1 ene 1973 año
3.579
-0.672
-15.8%
1 ene 1974 año
4.074
+0.495
13.84%
1 ene 1975 año
5.395
+1.321
32.43%
1 ene 1976 año
4.977
-0.417
-7.74%
1 ene 1977 año
4.353
-0.624
-12.54%
1 ene 1978 año
3.932
-0.421
-9.67%
1 ene 1979 año
3.633
-0.299
-7.61%
1 ene 1980 año
4.344
+0.711
19.57%
1 ene 1981 año
4.599
+0.255
5.88%
1 ene 1982 año
4.263
-0.336
-7.31%
1 ene 1983 año
4.35
+0.087
2.05%
1 ene 1984 año
3.327
-1.023
-23.51%
1 ene 1985 año
3.871
+0.544
16.35%
1 ene 1986 año
3.779
-0.092
-2.38%
1 ene 1987 año
3.86
+0.08
2.13%
1 ene 1988 año
4.007
+0.147
3.81%
1 ene 1989 año
4.444
+0.437
10.9%
1 ene 1990 año
4.796
+0.353
7.93%
1 ene 1991 año
4.551
-0.246
-5.12%
1 ene 1992 año
4.889
+0.338
7.43%
1 ene 1993 año
4.871
-0.018
-0.36%
1 ene 1994 año
5.385
+0.514
10.56%
1 ene 1995 año
4.951
-0.434
-8.06%
1 ene 1996 año
2.147
-2.805
-56.64%
1 ene 1997 año
2.29
+0.143
6.66%
1 ene 1998 año
1.713
-0.576
-25.17%
1 ene 1999 año
1.708
-0.006
-0.34%
1 ene 2000 año
1.795
+0.087
5.09%
1 ene 2001 año
1.938
+0.143
7.98%
1 ene 2002 año
2.105
+0.167
8.64%
1 ene 2003 año
1.578
-0.528
-25.06%
1 ene 2004 año
1.275
-0.302
-19.17%
1 ene 2005 año
1.021
-0.254
-19.91%
1 ene 2006 año
0.943
-0.079
-7.69%
1 ene 2007 año
0.871
-0.072
-7.59%
1 ene 2008 año
0.924
+0.053
6.09%
1 ene 2009 año
0.868
-0.057
-6.13%
1 ene 2010 año
0.915
+0.048
5.51%
1 ene 2011 año
0.982
+0.067
7.31%
1 ene 2012 año
0.896
-0.086
-8.76%
1 ene 2013 año
0.749
-0.147
-16.42%
1 ene 2014 año
0.743
-0.006
-0.77%
1 ene 2015 año
0.712
-0.032
-4.28%
Ranking de los países por los datos estadísticos actuales


Comentarios: