29
/es/
es
AIzaSyAYiBZKx7MnpbEhh9jyipgxe19OcubqV5w
April 1, 2024
267109
Trinidad and Tobago
TTO
true
2
1
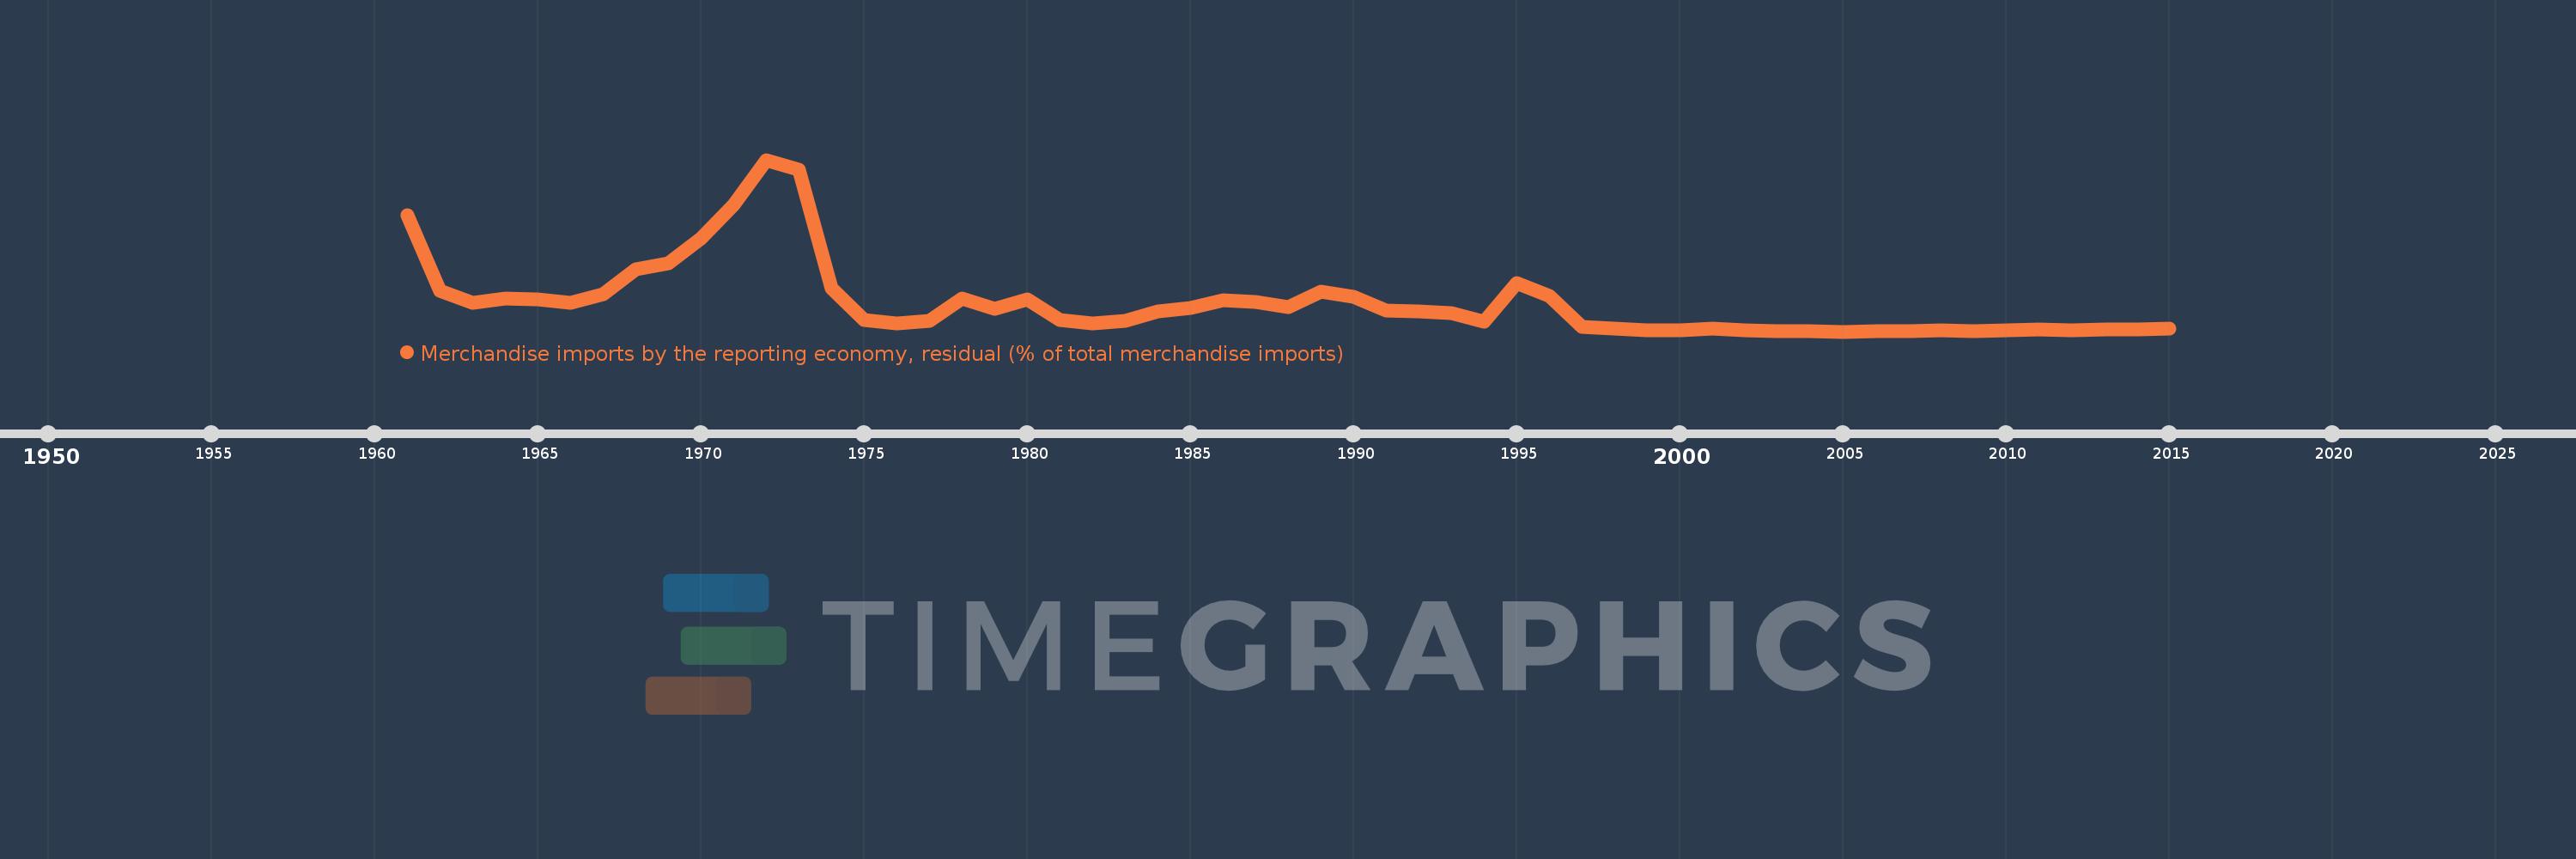
Merchandise imports by the reporting economy, residual (% of total merchandise imports)
2015,2014,2013,2012,2011,2010,2009,2008,2007,2006,2005,2004,2003,2002,2001,2000,1999,1998,1997,1996,1995,1994,1993,1992,1991,1990,1989,1988,1987,1986,1985,1984,1983,1982,1981,1980,1979,1978,1977,1976,1975,1974,1973,1972,1971,1970,1969,1968,1967,1966,1965,1964,1963,1962,1961
Estas estadísticas en otros países:
AfghanistanAlbaniaAlgeriaAmerican SamoaAngolaAntigua and BarbudaArab WorldArgentinaArmeniaArubaAustraliaAustriaAzerbaijanBahamas, TheBahrainBangladeshBarbadosBelarusBelgiumBelizeBeninBermudaBoliviaBosnia and HerzegovinaBrazilBrunei DarussalamBulgariaBurkina FasoBurundiCabo VerdeCambodiaCameroonCanadaCaribbean small statesCentral African RepublicCentral Europe and the BalticsChadChileChinaColombiaComorosCongo, Dem. Rep.Congo, Rep.Costa RicaCote d'IvoireCroatiaCubaCyprusCzech RepublicDenmarkDjiboutiDominicaDominican RepublicEarly-demographic dividendEast Asia & PacificEast Asia & Pacific (excluding high income)East Asia & Pacific (IDA & IBRD countries)EcuadorEgypt, Arab Rep.El SalvadorEquatorial GuineaEstoniaEthiopiaEuro areaEurope & Central AsiaEurope & Central Asia (excluding high income)Europe & Central Asia (IDA & IBRD countries)European UnionFaroe IslandsFijiFinlandFragile and conflict affected situationsFranceFrench PolynesiaGabonGambia, TheGeorgiaGermanyGhanaGibraltarGreeceGreenlandGrenadaGuamGuatemalaGuineaGuinea-BissauGuyanaHaitiHeavily indebted poor countries (HIPC)High incomeHondurasHong Kong SAR, ChinaHungaryIBRD onlyIcelandIDA & IBRD totalIDA blendIDA onlyIDA totalIndiaIndonesiaIran, Islamic Rep.IraqIrelandIsraelItalyJamaicaJapanJordanKazakhstanKenyaKiribatiKorea, Dem. People’s Rep.Korea, Rep.KosovoKuwaitKyrgyz RepublicLao PDRLate-demographic dividendLatin America & Caribbean Latin America & Caribbean (excluding high income)Latin America & the Caribbean (IDA & IBRD countries)LatviaLeast developed countries: UN classificationLebanonLiberiaLibyaLithuaniaLow & middle incomeLow incomeLower middle incomeLuxembourgMacao SAR, ChinaMacedonia, FYRMadagascarMalawiMalaysiaMaldivesMaliMaltaMauritaniaMauritiusMexicoMiddle East & North AfricaMiddle East & North Africa (excluding high income)Middle East & North Africa (IDA & IBRD countries)Middle incomeMoldovaMongoliaMontenegroMoroccoMozambiqueMyanmarNauruNepalNetherlandsNew CaledoniaNew ZealandNicaraguaNigerNigeriaNorth AmericaNorwayOECD membersOmanOther small statesPacific island small statesPakistanPanamaPapua New GuineaParaguayPeruPhilippinesPolandPortugalPost-demographic dividendPre-demographic dividendQatarRomaniaRussian FederationRwandaSamoaSao Tome and PrincipeSaudi ArabiaSenegalSerbiaSeychellesSierra LeoneSingaporeSlovak RepublicSloveniaSmall statesSolomon IslandsSomaliaSouth AfricaSouth AsiaSouth Asia (IDA & IBRD)SpainSri LankaSt. Kitts and NevisSt. LuciaSt. Vincent and the GrenadinesSub-Saharan Africa Sub-Saharan Africa (excluding high income)Sub-Saharan Africa (IDA & IBRD countries)SudanSurinameSwedenSwitzerlandSyrian Arab RepublicTajikistanTanzaniaThailandTogoTongaTrinidad and TobagoTunisiaTurkeyTurkmenistanTuvaluUgandaUkraineUnited Arab EmiratesUnited KingdomUnited StatesUpper middle incomeUruguayUzbekistanVanuatuVenezuela, RBVietnamWorldYemen, Rep.ZambiaZimbabwe línea de tiempo (timeline):
En esta escala de tiempo se presenta un gráfico de 1961 y 2015 de Trinidad and Tobago. Los datos de 1960 están ausentes. El número de observaciones reales por fecha: 55.
Fuente (nombre):
Indicadores del desarrollo mundial
Fuente (organización):
World Bank staff estimates based data from International Monetary Fund's Direction of Trade database.
Categorías:
Private Sector, Trade
Se ha actualizado:
23 abr 2017 año
Los indicadores de los cambios de valor en los últimos años
Mínimo:
0.236
1 ene 2005 año
Máximo:
17.694
1 ene 1972 año
A la fecha de observación
Valor
Cambio absoluto
El cambio con respecto al valor anterior
1 ene 1961 año
12.107
+12.107
0.0%
1 ene 1962 año
4.409
-7.698
-63.58%
1 ene 1963 año
3.171
-1.238
-28.07%
1 ene 1964 año
3.57
+0.399
12.57%
1 ene 1965 año
3.477
-0.093
-2.6%
1 ene 1966 año
3.183
-0.294
-8.45%
1 ene 1967 año
4.043
+0.86
27.01%
1 ene 1968 año
6.566
+2.523
62.41%
1 ene 1969 año
7.214
+0.648
9.87%
1 ene 1970 año
9.734
+2.52
34.93%
1 ene 1971 año
13.071
+3.337
34.28%
1 ene 1972 año
17.694
+4.623
35.36%
1 ene 1973 año
16.649
-1.045
-5.91%
1 ene 1974 año
4.618
-12.03
-72.26%
1 ene 1975 año
1.429
-3.19
-69.07%
1 ene 1976 año
1.033
-0.395
-27.66%
1 ene 1977 año
1.33
+0.296
28.68%
1 ene 1978 año
3.578
+2.248
169.05%
1 ene 1979 año
2.533
-1.044
-29.19%
1 ene 1980 año
3.467
+0.933
36.84%
1 ene 1981 año
1.4
-2.066
-59.6%
1 ene 1982 año
1.101
-0.3
-21.4%
1 ene 1983 año
1.369
+0.268
24.35%
1 ene 1984 año
2.251
+0.882
64.45%
1 ene 1985 año
2.615
+0.364
16.16%
1 ene 1986 año
3.423
+0.808
30.91%
1 ene 1987 año
3.244
-0.179
-5.24%
1 ene 1988 año
2.726
-0.518
-15.97%
1 ene 1989 año
4.276
+1.55
56.87%
1 ene 1990 año
3.797
-0.479
-11.21%
1 ene 1991 año
2.403
-1.394
-36.71%
1 ene 1992 año
2.256
-0.146
-6.09%
1 ene 1993 año
2.12
-0.136
-6.04%
1 ene 1994 año
1.261
-0.859
-40.5%
1 ene 1995 año
5.188
+3.926
311.29%
1 ene 1996 año
3.847
-1.341
-25.85%
1 ene 1997 año
0.706
-3.14
-81.64%
1 ene 1998 año
0.516
-0.191
-26.97%
1 ene 1999 año
0.335
-0.181
-35.12%
1 ene 2000 año
0.39
+0.056
16.59%
1 ene 2001 año
0.52
+0.129
33.16%
1 ene 2002 año
0.394
-0.125
-24.11%
1 ene 2003 año
0.264
-0.131
-33.16%
1 ene 2004 año
0.249
-0.015
-5.63%
1 ene 2005 año
0.236
-0.013
-5.14%
1 ene 2006 año
0.271
+0.035
14.64%
1 ene 2007 año
0.303
+0.032
11.96%
1 ene 2008 año
0.333
+0.03
9.81%
1 ene 2009 año
0.294
-0.039
-11.71%
1 ene 2010 año
0.37
+0.076
25.94%
1 ene 2011 año
0.484
+0.115
30.97%
1 ene 2012 año
0.405
-0.079
-16.32%
1 ene 2013 año
0.459
+0.054
13.25%
1 ene 2014 año
0.474
+0.015
3.23%
1 ene 2015 año
0.516
+0.042
8.94%
Ranking de los países por los datos estadísticos actuales


Comentarios: