29
/es/
es
AIzaSyAYiBZKx7MnpbEhh9jyipgxe19OcubqV5w
April 1, 2024
43645
Latin America & the Caribbean (IDA & IBRD countries)
TLA
false
2
1
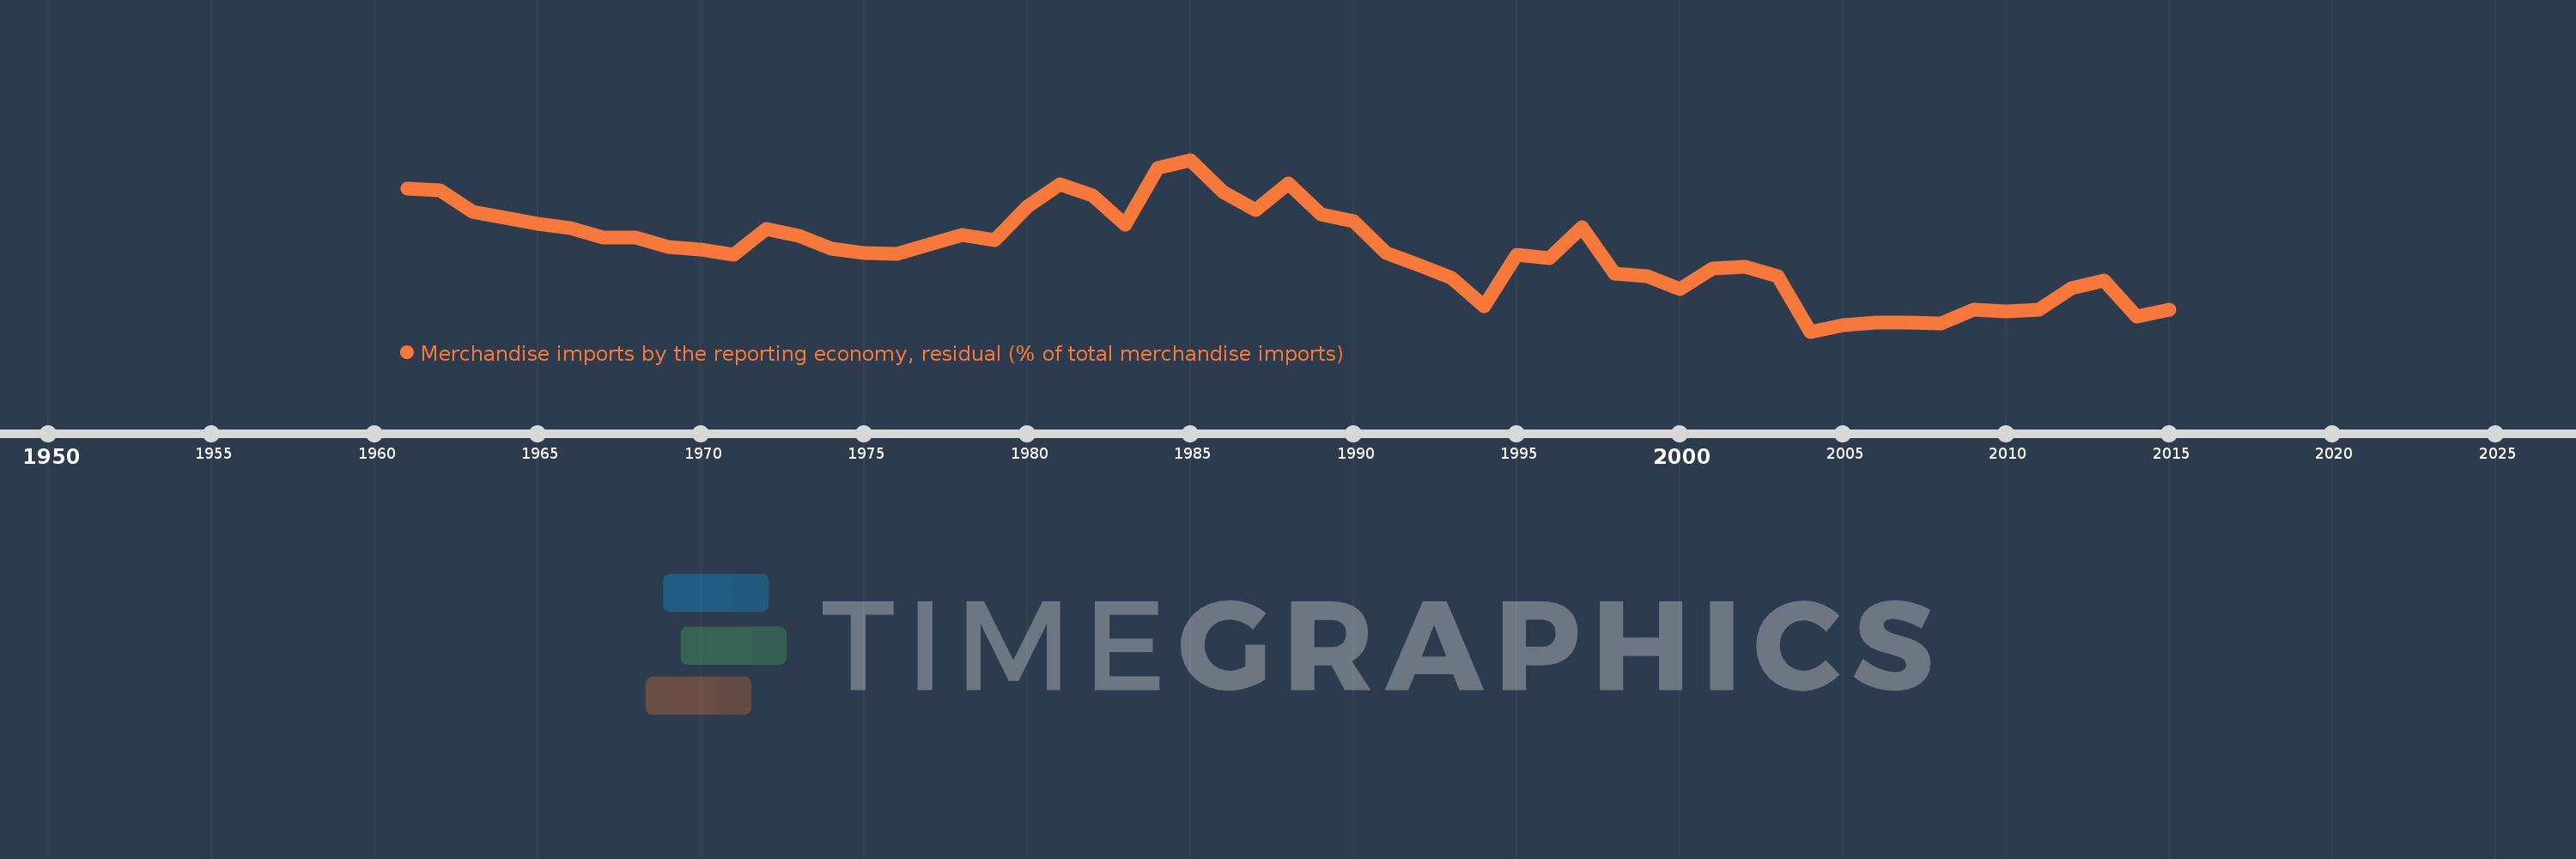
Merchandise imports by the reporting economy, residual (% of total merchandise imports)
2015,2014,2013,2012,2011,2010,2009,2008,2007,2006,2005,2004,2003,2002,2001,2000,1999,1998,1997,1996,1995,1994,1993,1992,1991,1990,1989,1988,1987,1986,1985,1984,1983,1982,1981,1980,1979,1978,1977,1976,1975,1974,1973,1972,1971,1970,1969,1968,1967,1966,1965,1964,1963,1962,1961
Estas estadísticas en otros países:
AfghanistanAlbaniaAlgeriaAmerican SamoaAngolaAntigua and BarbudaArab WorldArgentinaArmeniaArubaAustraliaAustriaAzerbaijanBahamas, TheBahrainBangladeshBarbadosBelarusBelgiumBelizeBeninBermudaBoliviaBosnia and HerzegovinaBrazilBrunei DarussalamBulgariaBurkina FasoBurundiCabo VerdeCambodiaCameroonCanadaCaribbean small statesCentral African RepublicCentral Europe and the BalticsChadChileChinaColombiaComorosCongo, Dem. Rep.Congo, Rep.Costa RicaCote d'IvoireCroatiaCubaCyprusCzech RepublicDenmarkDjiboutiDominicaDominican RepublicEarly-demographic dividendEast Asia & PacificEast Asia & Pacific (excluding high income)East Asia & Pacific (IDA & IBRD countries)EcuadorEgypt, Arab Rep.El SalvadorEquatorial GuineaEstoniaEthiopiaEuro areaEurope & Central AsiaEurope & Central Asia (excluding high income)Europe & Central Asia (IDA & IBRD countries)European UnionFaroe IslandsFijiFinlandFragile and conflict affected situationsFranceFrench PolynesiaGabonGambia, TheGeorgiaGermanyGhanaGibraltarGreeceGreenlandGrenadaGuamGuatemalaGuineaGuinea-BissauGuyanaHaitiHeavily indebted poor countries (HIPC)High incomeHondurasHong Kong SAR, ChinaHungaryIBRD onlyIcelandIDA & IBRD totalIDA blendIDA onlyIDA totalIndiaIndonesiaIran, Islamic Rep.IraqIrelandIsraelItalyJamaicaJapanJordanKazakhstanKenyaKiribatiKorea, Dem. People’s Rep.Korea, Rep.KosovoKuwaitKyrgyz RepublicLao PDRLate-demographic dividendLatin America & Caribbean Latin America & Caribbean (excluding high income)Latin America & the Caribbean (IDA & IBRD countries)LatviaLeast developed countries: UN classificationLebanonLiberiaLibyaLithuaniaLow & middle incomeLow incomeLower middle incomeLuxembourgMacao SAR, ChinaMacedonia, FYRMadagascarMalawiMalaysiaMaldivesMaliMaltaMauritaniaMauritiusMexicoMiddle East & North AfricaMiddle East & North Africa (excluding high income)Middle East & North Africa (IDA & IBRD countries)Middle incomeMoldovaMongoliaMontenegroMoroccoMozambiqueMyanmarNauruNepalNetherlandsNew CaledoniaNew ZealandNicaraguaNigerNigeriaNorth AmericaNorwayOECD membersOmanOther small statesPacific island small statesPakistanPanamaPapua New GuineaParaguayPeruPhilippinesPolandPortugalPost-demographic dividendPre-demographic dividendQatarRomaniaRussian FederationRwandaSamoaSao Tome and PrincipeSaudi ArabiaSenegalSerbiaSeychellesSierra LeoneSingaporeSlovak RepublicSloveniaSmall statesSolomon IslandsSomaliaSouth AfricaSouth AsiaSouth Asia (IDA & IBRD)SpainSri LankaSt. Kitts and NevisSt. LuciaSt. Vincent and the GrenadinesSub-Saharan Africa Sub-Saharan Africa (excluding high income)Sub-Saharan Africa (IDA & IBRD countries)SudanSurinameSwedenSwitzerlandSyrian Arab RepublicTajikistanTanzaniaThailandTogoTongaTrinidad and TobagoTunisiaTurkeyTurkmenistanTuvaluUgandaUkraineUnited Arab EmiratesUnited KingdomUnited StatesUpper middle incomeUruguayUzbekistanVanuatuVenezuela, RBVietnamWorldYemen, Rep.ZambiaZimbabwe línea de tiempo (timeline):
En esta escala de tiempo se presenta un gráfico de 1961 y 2015 de Latin America & the Caribbean (IDA & IBRD countries). Los datos de 1960 están ausentes. El número de observaciones reales por fecha: 55.
Fuente (nombre):
Indicadores del desarrollo mundial
Fuente (organización):
World Bank staff estimates based data from International Monetary Fund's Direction of Trade database.
Categorías:
Private Sector, Trade
Se ha actualizado:
23 abr 2017 año
Los indicadores de los cambios de valor en los últimos años
Mínimo:
1.817
1 ene 2004 año
Máximo:
7.067
1 ene 1985 año
A la fecha de observación
Valor
Cambio absoluto
El cambio con respecto al valor anterior
1 ene 1961 año
6.198
+6.198
0.0%
1 ene 1962 año
6.123
-0.075
-1.22%
1 ene 1963 año
5.477
-0.645
-10.54%
1 ene 1964 año
5.296
-0.181
-3.3%
1 ene 1965 año
5.123
-0.174
-3.28%
1 ene 1966 año
4.979
-0.144
-2.82%
1 ene 1967 año
4.681
-0.297
-5.97%
1 ene 1968 año
4.703
+0.021
0.45%
1 ene 1969 año
4.409
-0.294
-6.25%
1 ene 1970 año
4.319
-0.089
-2.03%
1 ene 1971 año
4.169
-0.151
-3.49%
1 ene 1972 año
4.949
+0.78
18.71%
1 ene 1973 año
4.752
-0.197
-3.99%
1 ene 1974 año
4.353
-0.399
-8.39%
1 ene 1975 año
4.207
-0.146
-3.34%
1 ene 1976 año
4.185
-0.022
-0.52%
1 ene 1977 año
4.477
+0.292
6.97%
1 ene 1978 año
4.779
+0.302
6.75%
1 ene 1979 año
4.603
-0.176
-3.68%
1 ene 1980 año
5.643
+1.039
22.58%
1 ene 1981 año
6.322
+0.679
12.04%
1 ene 1982 año
5.972
-0.35
-5.54%
1 ene 1983 año
5.083
-0.889
-14.89%
1 ene 1984 año
6.827
+1.745
34.33%
1 ene 1985 año
7.067
+0.24
3.52%
1 ene 1986 año
6.09
-0.977
-13.83%
1 ene 1987 año
5.541
-0.55
-9.02%
1 ene 1988 año
6.337
+0.796
14.37%
1 ene 1989 año
5.398
-0.938
-14.81%
1 ene 1990 año
5.191
-0.208
-3.85%
1 ene 1991 año
4.213
-0.977
-18.83%
1 ene 1992 año
3.841
-0.373
-8.85%
1 ene 1993 año
3.463
-0.377
-9.82%
1 ene 1994 año
2.604
-0.859
-24.81%
1 ene 1995 año
4.158
+1.553
59.65%
1 ene 1996 año
4.065
-0.093
-2.23%
1 ene 1997 año
5.013
+0.949
23.34%
1 ene 1998 año
3.587
-1.427
-28.46%
1 ene 1999 año
3.513
-0.074
-2.06%
1 ene 2000 año
3.124
-0.388
-11.06%
1 ene 2001 año
3.746
+0.621
19.89%
1 ene 2002 año
3.812
+0.067
1.78%
1 ene 2003 año
3.515
-0.297
-7.8%
1 ene 2004 año
1.817
-1.698
-48.3%
1 ene 2005 año
2.025
+0.208
11.47%
1 ene 2006 año
2.102
+0.076
3.76%
1 ene 2007 año
2.082
-0.019
-0.93%
1 ene 2008 año
2.072
-0.01
-0.5%
1 ene 2009 año
2.49
+0.418
20.19%
1 ene 2010 año
2.447
-0.043
-1.73%
1 ene 2011 año
2.474
+0.027
1.12%
1 ene 2012 año
3.152
+0.677
27.37%
1 ene 2013 año
3.38
+0.228
7.23%
1 ene 2014 año
2.264
-1.116
-33.02%
1 ene 2015 año
2.497
+0.233
10.3%
Ranking de los países por los datos estadísticos actuales


Comentarios: