29
/es/
es
AIzaSyAYiBZKx7MnpbEhh9jyipgxe19OcubqV5w
April 1, 2024
209555
New Zealand
NZL
true
2
1
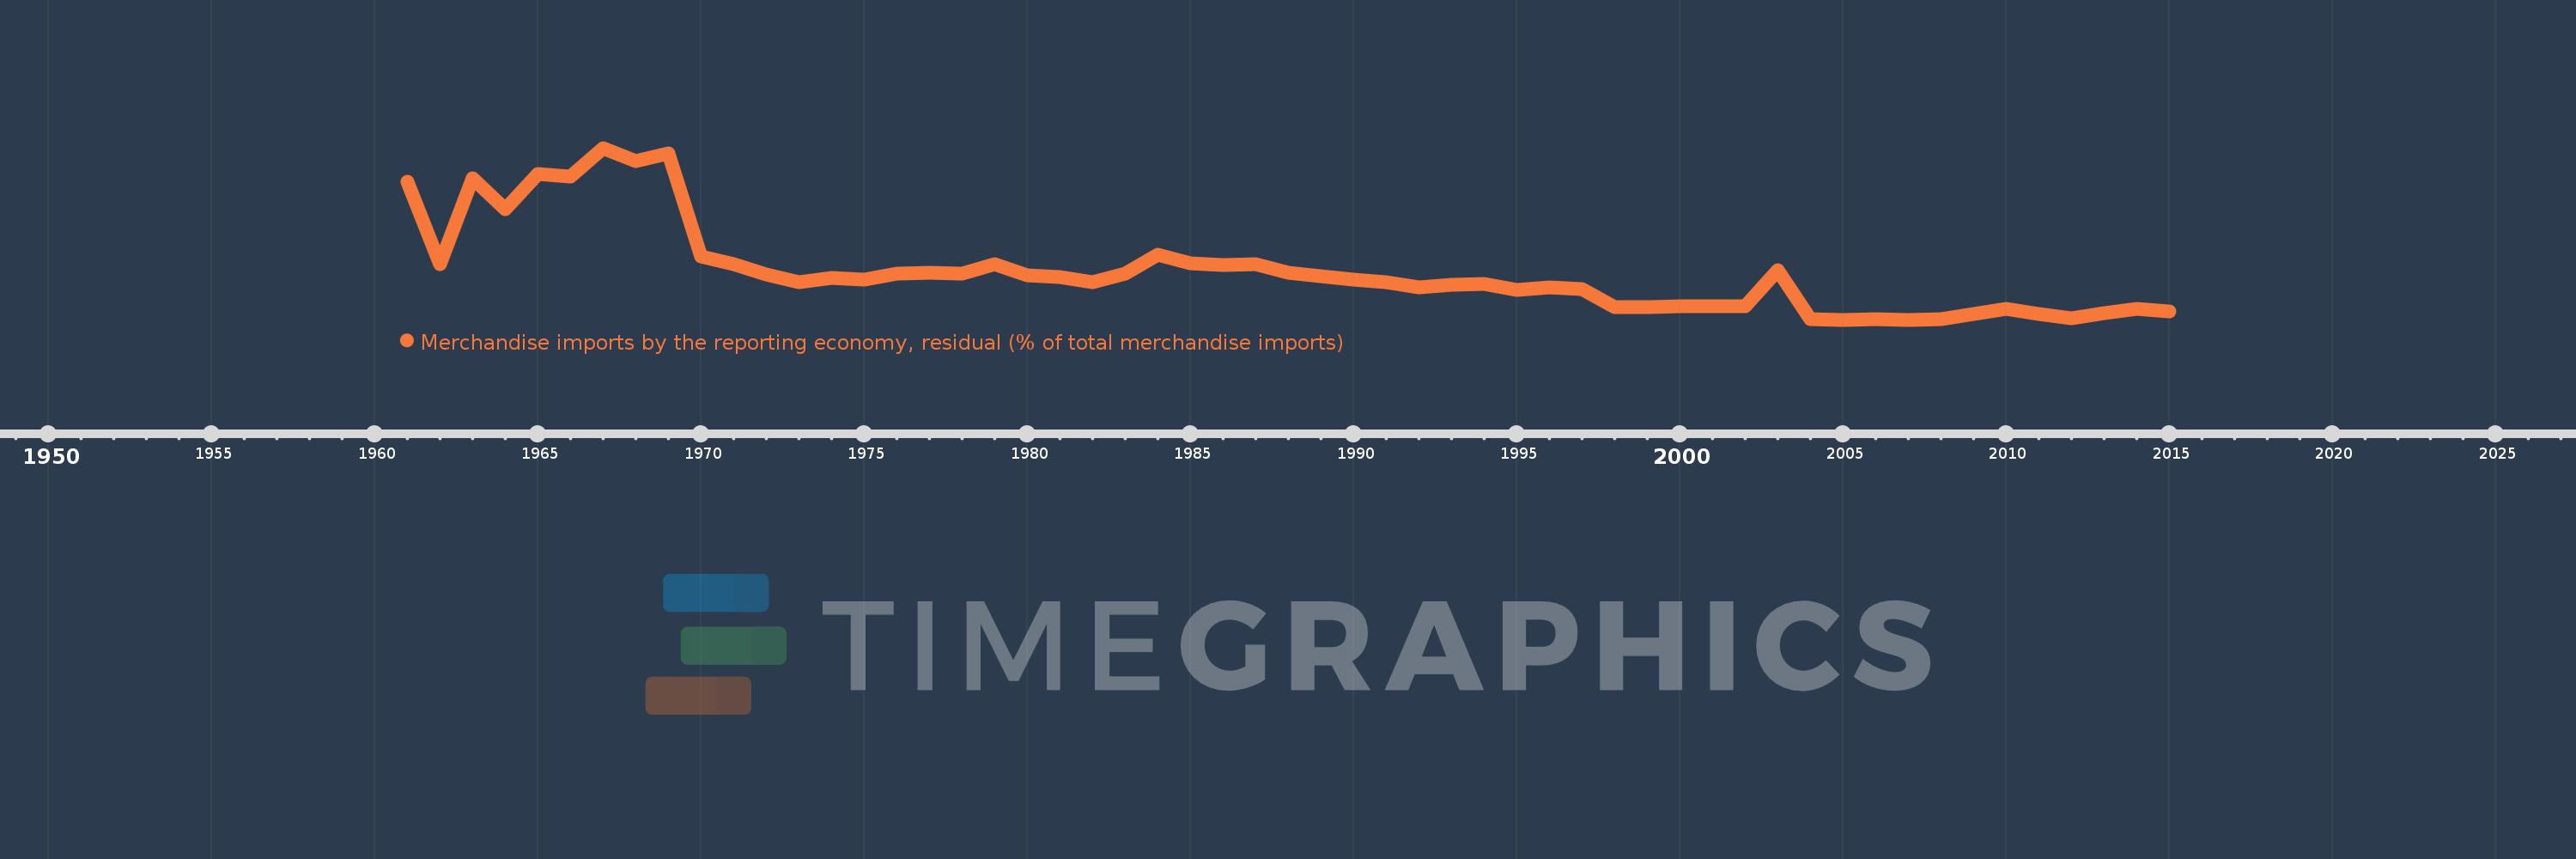
Merchandise imports by the reporting economy, residual (% of total merchandise imports)
2015,2014,2013,2012,2011,2010,2009,2008,2007,2006,2005,2004,2003,2002,2001,2000,1999,1998,1997,1996,1995,1994,1993,1992,1991,1990,1989,1988,1987,1986,1985,1984,1983,1982,1981,1980,1979,1978,1977,1976,1975,1974,1973,1972,1971,1970,1969,1968,1967,1966,1965,1964,1963,1962,1961
Estas estadísticas en otros países:
AfghanistanAlbaniaAlgeriaAmerican SamoaAngolaAntigua and BarbudaArab WorldArgentinaArmeniaArubaAustraliaAustriaAzerbaijanBahamas, TheBahrainBangladeshBarbadosBelarusBelgiumBelizeBeninBermudaBoliviaBosnia and HerzegovinaBrazilBrunei DarussalamBulgariaBurkina FasoBurundiCabo VerdeCambodiaCameroonCanadaCaribbean small statesCentral African RepublicCentral Europe and the BalticsChadChileChinaColombiaComorosCongo, Dem. Rep.Congo, Rep.Costa RicaCote d'IvoireCroatiaCubaCyprusCzech RepublicDenmarkDjiboutiDominicaDominican RepublicEarly-demographic dividendEast Asia & PacificEast Asia & Pacific (excluding high income)East Asia & Pacific (IDA & IBRD countries)EcuadorEgypt, Arab Rep.El SalvadorEquatorial GuineaEstoniaEthiopiaEuro areaEurope & Central AsiaEurope & Central Asia (excluding high income)Europe & Central Asia (IDA & IBRD countries)European UnionFaroe IslandsFijiFinlandFragile and conflict affected situationsFranceFrench PolynesiaGabonGambia, TheGeorgiaGermanyGhanaGibraltarGreeceGreenlandGrenadaGuamGuatemalaGuineaGuinea-BissauGuyanaHaitiHeavily indebted poor countries (HIPC)High incomeHondurasHong Kong SAR, ChinaHungaryIBRD onlyIcelandIDA & IBRD totalIDA blendIDA onlyIDA totalIndiaIndonesiaIran, Islamic Rep.IraqIrelandIsraelItalyJamaicaJapanJordanKazakhstanKenyaKiribatiKorea, Dem. People’s Rep.Korea, Rep.KosovoKuwaitKyrgyz RepublicLao PDRLate-demographic dividendLatin America & Caribbean Latin America & Caribbean (excluding high income)Latin America & the Caribbean (IDA & IBRD countries)LatviaLeast developed countries: UN classificationLebanonLiberiaLibyaLithuaniaLow & middle incomeLow incomeLower middle incomeLuxembourgMacao SAR, ChinaMacedonia, FYRMadagascarMalawiMalaysiaMaldivesMaliMaltaMauritaniaMauritiusMexicoMiddle East & North AfricaMiddle East & North Africa (excluding high income)Middle East & North Africa (IDA & IBRD countries)Middle incomeMoldovaMongoliaMontenegroMoroccoMozambiqueMyanmarNauruNepalNetherlandsNew CaledoniaNew ZealandNicaraguaNigerNigeriaNorth AmericaNorwayOECD membersOmanOther small statesPacific island small statesPakistanPanamaPapua New GuineaParaguayPeruPhilippinesPolandPortugalPost-demographic dividendPre-demographic dividendQatarRomaniaRussian FederationRwandaSamoaSao Tome and PrincipeSaudi ArabiaSenegalSerbiaSeychellesSierra LeoneSingaporeSlovak RepublicSloveniaSmall statesSolomon IslandsSomaliaSouth AfricaSouth AsiaSouth Asia (IDA & IBRD)SpainSri LankaSt. Kitts and NevisSt. LuciaSt. Vincent and the GrenadinesSub-Saharan Africa Sub-Saharan Africa (excluding high income)Sub-Saharan Africa (IDA & IBRD countries)SudanSurinameSwedenSwitzerlandSyrian Arab RepublicTajikistanTanzaniaThailandTogoTongaTrinidad and TobagoTunisiaTurkeyTurkmenistanTuvaluUgandaUkraineUnited Arab EmiratesUnited KingdomUnited StatesUpper middle incomeUruguayUzbekistanVanuatuVenezuela, RBVietnamWorldYemen, Rep.ZambiaZimbabwe línea de tiempo (timeline):
En esta escala de tiempo se presenta un gráfico de 1961 y 2015 de New Zealand. Los datos de 1960 están ausentes. El número de observaciones reales por fecha: 55.
Fuente (nombre):
Indicadores del desarrollo mundial
Fuente (organización):
World Bank staff estimates based data from International Monetary Fund's Direction of Trade database.
Categorías:
Private Sector, Trade
Se ha actualizado:
23 abr 2017 año
Los indicadores de los cambios de valor en los últimos años
Mínimo:
0.01
1 ene 2005 año
Máximo:
7.614
1 ene 1967 año
A la fecha de observación
Valor
Cambio absoluto
El cambio con respecto al valor anterior
1 ene 1961 año
6.132
+6.132
0.0%
1 ene 1962 año
2.473
-3.659
-59.68%
1 ene 1963 año
6.283
+3.81
154.08%
1 ene 1964 año
4.909
-1.373
-21.86%
1 ene 1965 año
6.479
+1.57
31.97%
1 ene 1966 año
6.336
-0.142
-2.2%
1 ene 1967 año
7.614
+1.277
20.16%
1 ene 1968 año
7.043
-0.571
-7.49%
1 ene 1969 año
7.362
+0.319
4.52%
1 ene 1970 año
2.828
-4.533
-61.58%
1 ene 1971 año
2.453
-0.376
-13.29%
1 ene 1972 año
2.031
-0.422
-17.2%
1 ene 1973 año
1.654
-0.377
-18.54%
1 ene 1974 año
1.849
+0.195
11.79%
1 ene 1975 año
1.785
-0.064
-3.46%
1 ene 1976 año
2.06
+0.275
15.39%
1 ene 1977 año
2.085
+0.025
1.23%
1 ene 1978 año
2.062
-0.023
-1.1%
1 ene 1979 año
2.468
+0.406
19.7%
1 ene 1980 año
1.962
-0.507
-20.53%
1 ene 1981 año
1.914
-0.047
-2.42%
1 ene 1982 año
1.671
-0.244
-12.72%
1 ene 1983 año
2.042
+0.371
22.22%
1 ene 1984 año
2.878
+0.836
40.97%
1 ene 1985 año
2.518
-0.36
-12.5%
1 ene 1986 año
2.435
-0.084
-3.33%
1 ene 1987 año
2.466
+0.032
1.31%
1 ene 1988 año
2.076
-0.39
-15.83%
1 ene 1989 año
1.927
-0.149
-7.18%
1 ene 1990 año
1.778
-0.149
-7.75%
1 ene 1991 año
1.676
-0.101
-5.69%
1 ene 1992 año
1.45
-0.226
-13.5%
1 ene 1993 año
1.54
+0.089
6.16%
1 ene 1994 año
1.59
+0.05
3.25%
1 ene 1995 año
1.341
-0.249
-15.67%
1 ene 1996 año
1.451
+0.11
8.21%
1 ene 1997 año
1.386
-0.064
-4.43%
1 ene 1998 año
0.56
-0.826
-59.59%
1 ene 1999 año
0.571
+0.01
1.86%
1 ene 2000 año
0.618
+0.048
8.35%
1 ene 2001 año
0.614
-0.005
-0.78%
1 ene 2002 año
0.613
-0.001
-0.12%
1 ene 2003 año
2.189
+1.576
257.2%
1 ene 2004 año
0.018
-2.171
-99.16%
1 ene 2005 año
0.01
-0.009
-46.59%
1 ene 2006 año
0.03
+0.02
206.3%
1 ene 2007 año
0.012
-0.018
-59.02%
1 ene 2008 año
0.018
+0.006
45.56%
1 ene 2009 año
0.258
+0.24
1.34 mil%
1 ene 2010 año
0.482
+0.224
86.78%
1 ene 2011 año
0.268
-0.214
-44.39%
1 ene 2012 año
0.058
-0.21
-78.49%
1 ene 2013 año
0.287
+0.229
397.54%
1 ene 2014 año
0.482
+0.195
68.0%
1 ene 2015 año
0.395
-0.086
-17.94%
Ranking de los países por los datos estadísticos actuales


Comentarios: