29
/es/
es
AIzaSyAYiBZKx7MnpbEhh9jyipgxe19OcubqV5w
April 1, 2024
38355
IDA blend
IDB
false
2
1
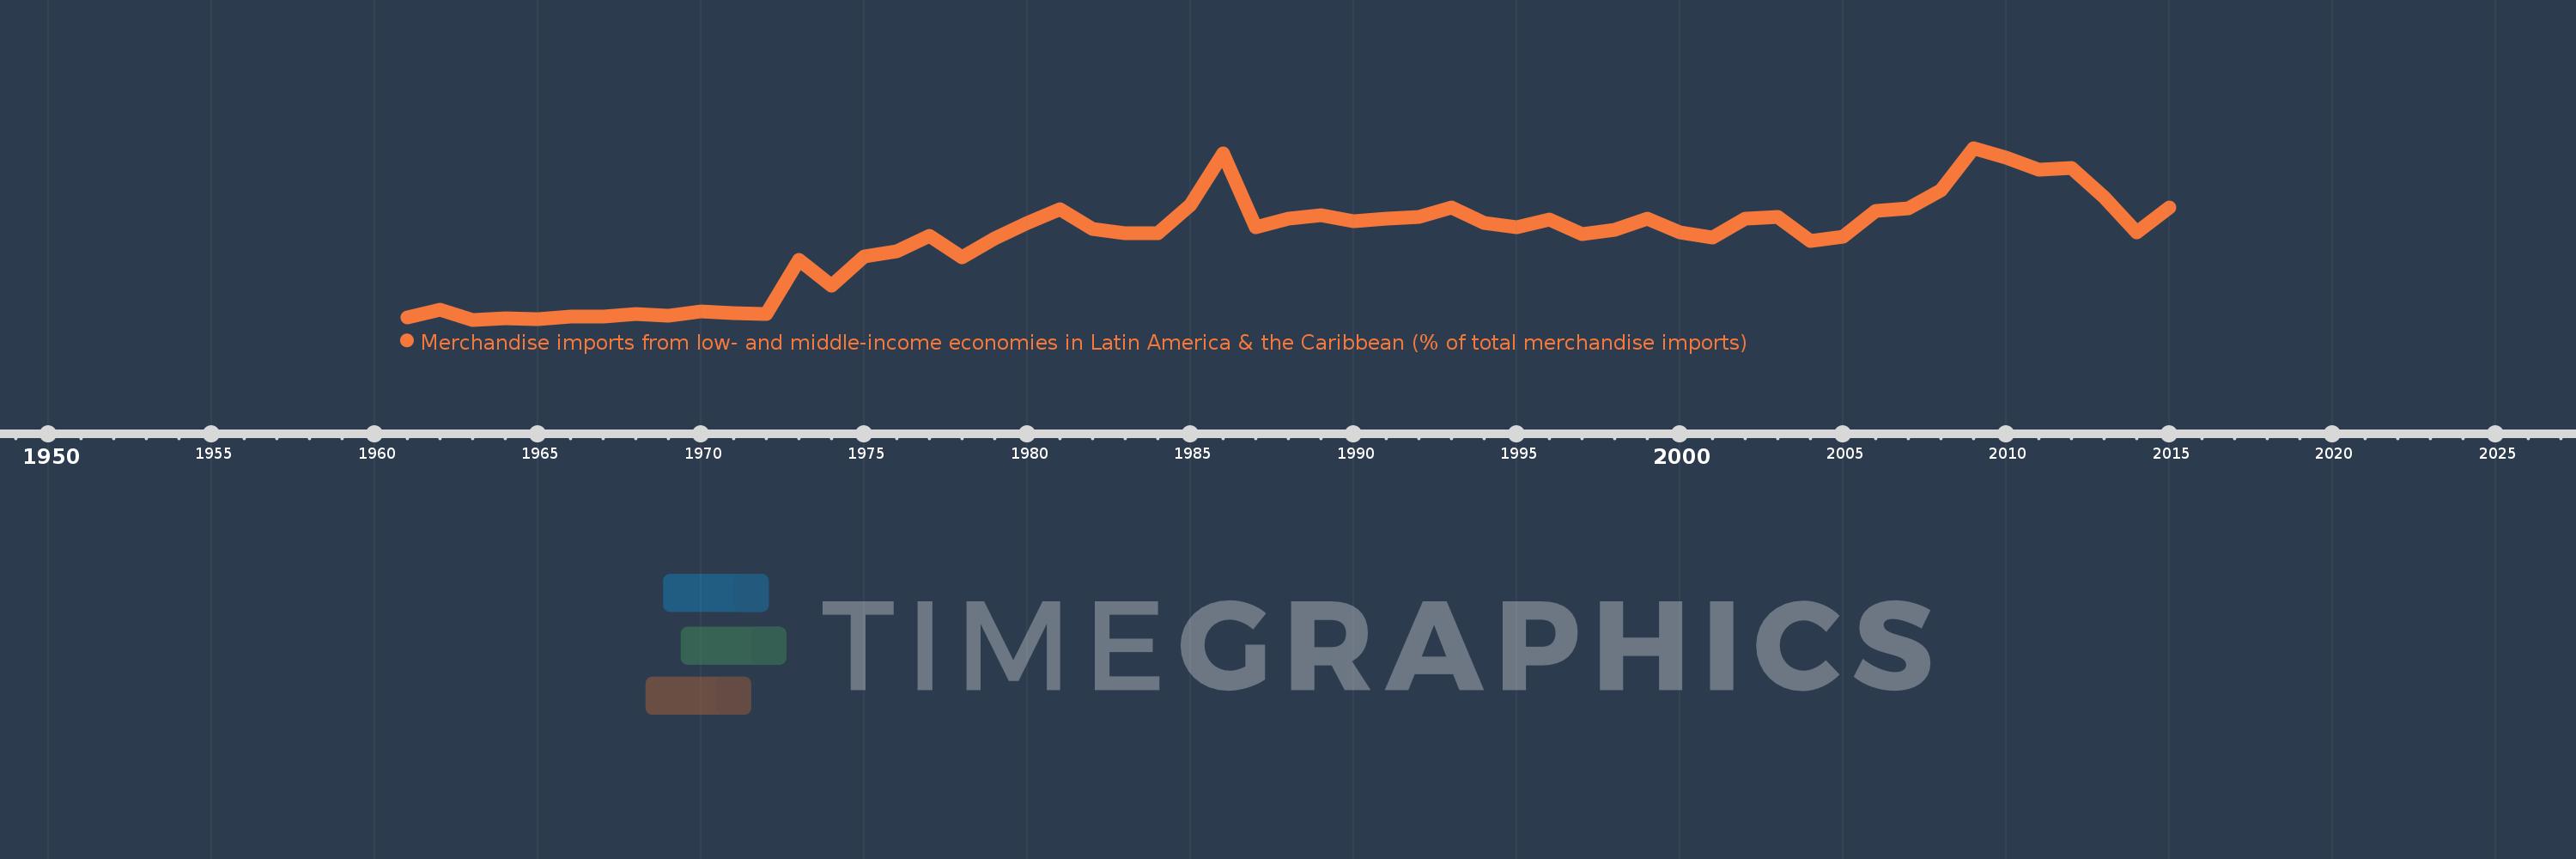
Merchandise imports from low- and middle-income economies in Latin America & the Caribbean (% of total merchandise imports)
2015,2014,2013,2012,2011,2010,2009,2008,2007,2006,2005,2004,2003,2002,2001,2000,1999,1998,1997,1996,1995,1994,1993,1992,1991,1990,1989,1988,1987,1986,1985,1984,1983,1982,1981,1980,1979,1978,1977,1976,1975,1974,1973,1972,1971,1970,1969,1968,1967,1966,1965,1964,1963,1962,1961
Estas estadísticas en otros países:
AfghanistanAlbaniaAlgeriaAngolaAntigua and BarbudaArab WorldArgentinaArmeniaArubaAustraliaAustriaAzerbaijanBahamas, TheBahrainBangladeshBarbadosBelarusBelgiumBelizeBeninBermudaBoliviaBrazilBrunei DarussalamBulgariaBurkina FasoCabo VerdeCambodiaCameroonCanadaCaribbean small statesCentral African RepublicCentral Europe and the BalticsChileChinaColombiaCongo, Dem. Rep.Congo, Rep.Costa RicaCote d'IvoireCroatiaCubaCyprusCzech RepublicDenmarkDominicaDominican RepublicEarly-demographic dividendEast Asia & PacificEast Asia & Pacific (excluding high income)East Asia & Pacific (IDA & IBRD countries)EcuadorEgypt, Arab Rep.El SalvadorEstoniaEthiopiaEuro areaEurope & Central AsiaEurope & Central Asia (excluding high income)Europe & Central Asia (IDA & IBRD countries)European UnionFaroe IslandsFijiFinlandFragile and conflict affected situationsFranceFrench PolynesiaGabonGambia, TheGeorgiaGermanyGhanaGibraltarGreeceGreenlandGrenadaGuatemalaGuineaGuyanaHaitiHeavily indebted poor countries (HIPC)High incomeHondurasHong Kong SAR, ChinaHungaryIBRD onlyIcelandIDA & IBRD totalIDA blendIDA onlyIDA totalIndiaIndonesiaIran, Islamic Rep.IraqIrelandIsraelItalyJamaicaJapanJordanKazakhstanKenyaKorea, Dem. People’s Rep.Korea, Rep.KuwaitKyrgyz RepublicLate-demographic dividendLatin America & Caribbean Latin America & Caribbean (excluding high income)Latin America & the Caribbean (IDA & IBRD countries)LatviaLeast developed countries: UN classificationLebanonLiberiaLibyaLithuaniaLow & middle incomeLow incomeLower middle incomeLuxembourgMacao SAR, ChinaMacedonia, FYRMadagascarMalawiMalaysiaMaldivesMaliMaltaMauritaniaMauritiusMexicoMiddle East & North AfricaMiddle East & North Africa (excluding high income)Middle East & North Africa (IDA & IBRD countries)Middle incomeMoldovaMongoliaMontenegroMoroccoMozambiqueNetherlandsNew CaledoniaNew ZealandNicaraguaNigerNigeriaNorth AmericaNorwayOECD membersOmanOther small statesPacific island small statesPakistanPanamaPapua New GuineaParaguayPeruPhilippinesPolandPortugalPost-demographic dividendPre-demographic dividendQatarRomaniaRussian FederationSaudi ArabiaSenegalSerbiaSierra LeoneSingaporeSlovak RepublicSloveniaSmall statesSomaliaSouth AfricaSouth AsiaSouth Asia (IDA & IBRD)SpainSri LankaSt. Kitts and NevisSt. LuciaSt. Vincent and the GrenadinesSub-Saharan Africa Sub-Saharan Africa (excluding high income)Sub-Saharan Africa (IDA & IBRD countries)SudanSurinameSwedenSwitzerlandSyrian Arab RepublicTanzaniaThailandTogoTrinidad and TobagoTunisiaTurkeyUgandaUkraineUnited Arab EmiratesUnited KingdomUnited StatesUpper middle incomeUruguayVenezuela, RBVietnamWorldYemen, Rep.ZambiaZimbabwe línea de tiempo (timeline):
En esta escala de tiempo se presenta un gráfico de 1961 y 2015 de IDA blend. Los datos de 1960 están ausentes. El número de observaciones reales por fecha: 55.
Fuente (nombre):
Indicadores del desarrollo mundial
Fuente (organización):
World Bank staff estimates based data from International Monetary Fund's Direction of Trade database.
Categorías:
Private Sector, Trade
Se ha actualizado:
23 abr 2017 año
Los indicadores de los cambios de valor en los últimos años
Mínimo:
0.165
1 ene 1963 año
Máximo:
3.664
1 ene 2009 año
A la fecha de observación
Valor
Cambio absoluto
El cambio con respecto al valor anterior
1 ene 1961 año
0.219
+0.219
0.0%
1 ene 1962 año
0.363
+0.144
65.86%
1 ene 1963 año
0.165
-0.197
-54.4%
1 ene 1964 año
0.196
+0.03
18.21%
1 ene 1965 año
0.181
-0.015
-7.55%
1 ene 1966 año
0.222
+0.041
22.71%
1 ene 1967 año
0.236
+0.014
6.25%
1 ene 1968 año
0.289
+0.053
22.53%
1 ene 1969 año
0.253
-0.036
-12.55%
1 ene 1970 año
0.326
+0.073
28.94%
1 ene 1971 año
0.295
-0.031
-9.48%
1 ene 1972 año
0.29
-0.004
-1.52%
1 ene 1973 año
1.388
+1.098
378.13%
1 ene 1974 año
0.852
-0.536
-38.62%
1 ene 1975 año
1.459
+0.607
71.27%
1 ene 1976 año
1.552
+0.092
6.34%
1 ene 1977 año
1.872
+0.321
20.67%
1 ene 1978 año
1.44
-0.432
-23.08%
1 ene 1979 año
1.825
+0.384
26.69%
1 ene 1980 año
2.14
+0.316
17.31%
1 ene 1981 año
2.415
+0.274
12.82%
1 ene 1982 año
2.011
-0.404
-16.74%
1 ene 1983 año
1.928
-0.083
-4.13%
1 ene 1984 año
1.919
-0.009
-0.45%
1 ene 1985 año
2.496
+0.577
30.05%
1 ene 1986 año
3.547
+1.051
42.13%
1 ene 1987 año
2.051
-1.496
-42.18%
1 ene 1988 año
2.222
+0.171
8.35%
1 ene 1989 año
2.301
+0.078
3.53%
1 ene 1990 año
2.167
-0.134
-5.82%
1 ene 1991 año
2.232
+0.066
3.03%
1 ene 1992 año
2.261
+0.029
1.28%
1 ene 1993 año
2.445
+0.184
8.13%
1 ene 1994 año
2.134
-0.311
-12.7%
1 ene 1995 año
2.05
-0.084
-3.96%
1 ene 1996 año
2.208
+0.158
7.73%
1 ene 1997 año
1.911
-0.297
-13.45%
1 ene 1998 año
1.993
+0.082
4.28%
1 ene 1999 año
2.228
+0.235
11.79%
1 ene 2000 año
1.94
-0.288
-12.91%
1 ene 2001 año
1.846
-0.095
-4.87%
1 ene 2002 año
2.228
+0.382
20.71%
1 ene 2003 año
2.263
+0.035
1.56%
1 ene 2004 año
1.765
-0.498
-22.01%
1 ene 2005 año
1.853
+0.089
5.02%
1 ene 2006 año
2.382
+0.529
28.52%
1 ene 2007 año
2.433
+0.051
2.14%
1 ene 2008 año
2.797
+0.364
14.97%
1 ene 2009 año
3.664
+0.867
31.01%
1 ene 2010 año
3.466
-0.199
-5.42%
1 ene 2011 año
3.219
-0.247
-7.11%
1 ene 2012 año
3.252
+0.033
1.02%
1 ene 2013 año
2.667
-0.585
-17.98%
1 ene 2014 año
1.937
-0.73
-27.38%
1 ene 2015 año
2.445
+0.508
26.2%
Ranking de los países por los datos estadísticos actuales


Comentarios: