29
/es/
es
AIzaSyAYiBZKx7MnpbEhh9jyipgxe19OcubqV5w
April 1, 2024
185473
Madagascar
MDG
true
2
1
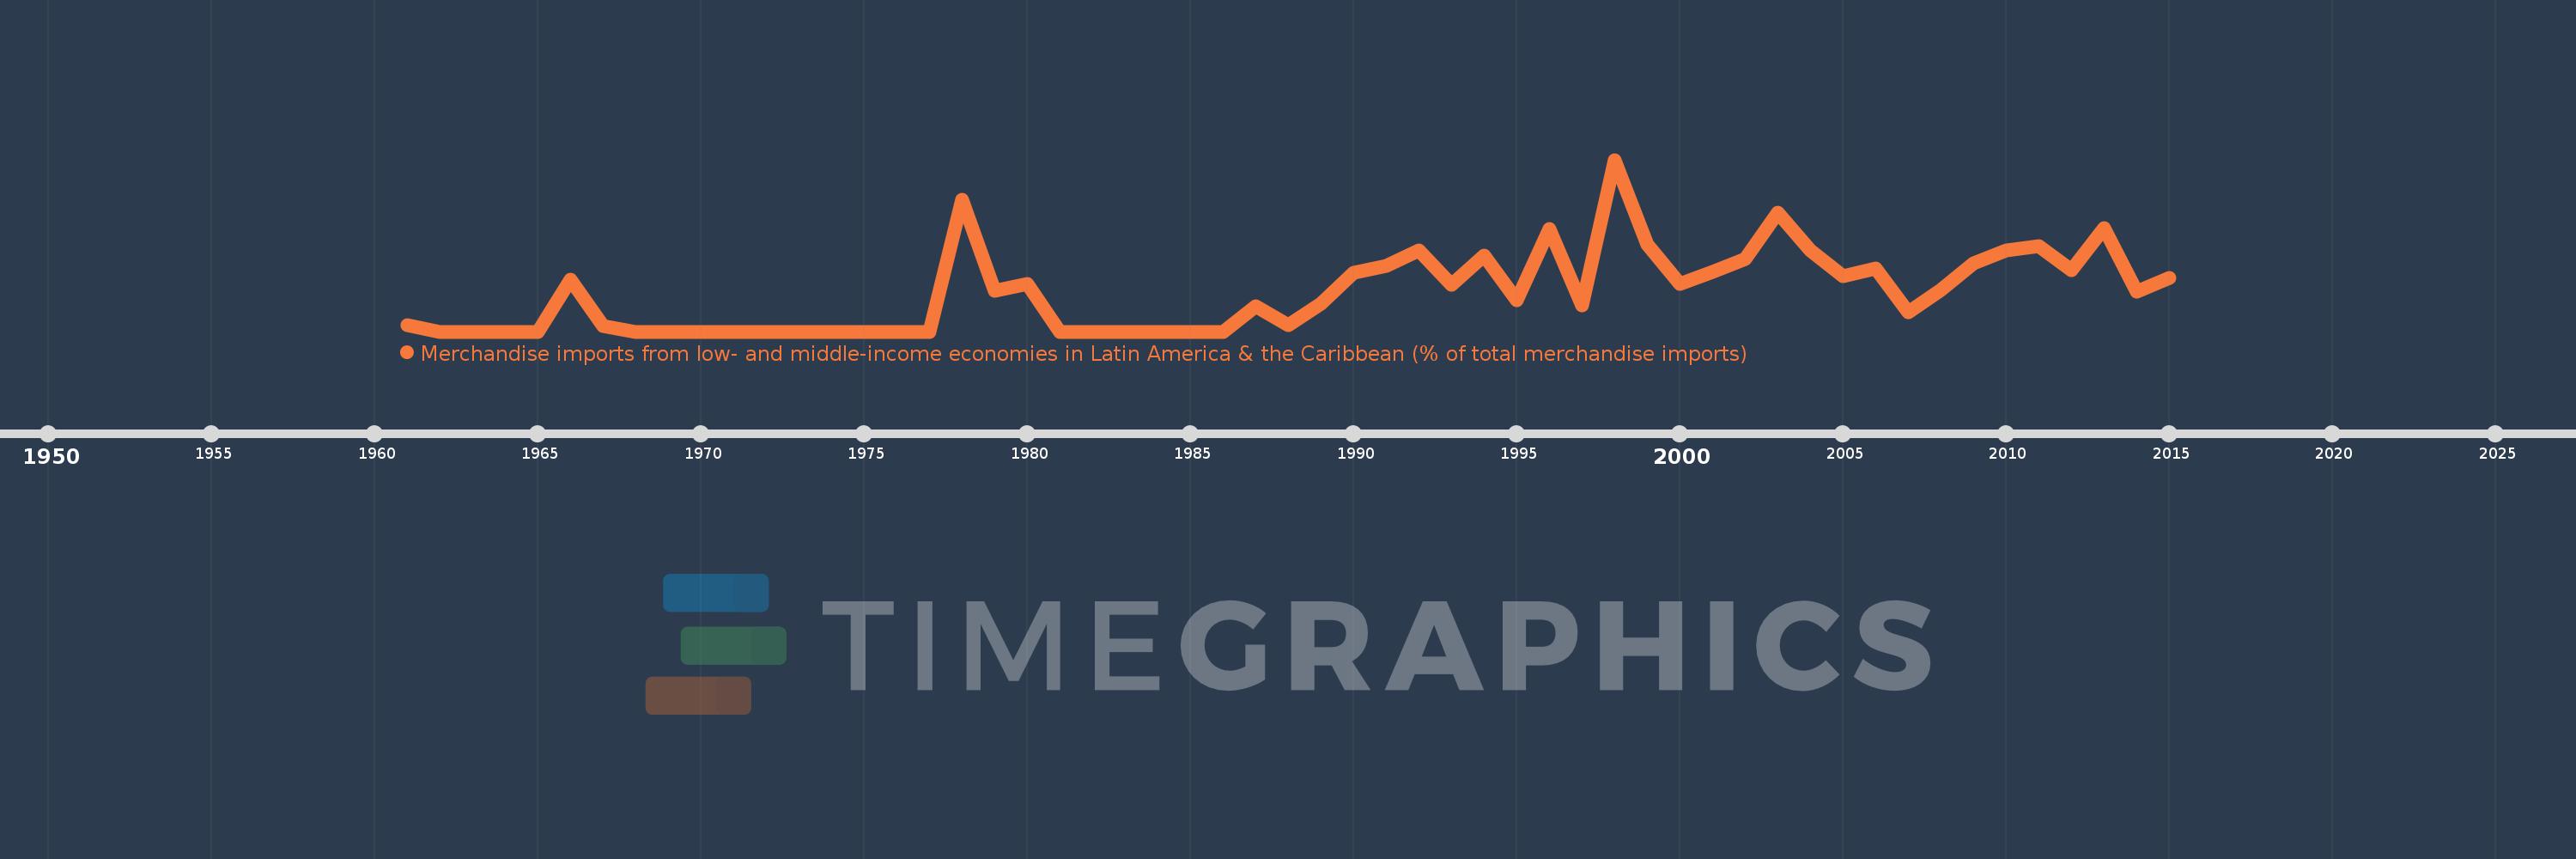
Merchandise imports from low- and middle-income economies in Latin America & the Caribbean (% of total merchandise imports)
2015,2014,2013,2012,2011,2010,2009,2008,2007,2006,2005,2004,2003,2002,2001,2000,1999,1998,1997,1996,1995,1994,1993,1992,1991,1990,1989,1988,1987,1986,1985,1984,1983,1982,1981,1980,1979,1978,1977,1976,1975,1974,1973,1972,1971,1970,1969,1968,1967,1966,1965,1964,1963,1962,1961
Estas estadísticas en otros países:
AfghanistanAlbaniaAlgeriaAngolaAntigua and BarbudaArab WorldArgentinaArmeniaArubaAustraliaAustriaAzerbaijanBahamas, TheBahrainBangladeshBarbadosBelarusBelgiumBelizeBeninBermudaBoliviaBrazilBrunei DarussalamBulgariaBurkina FasoCabo VerdeCambodiaCameroonCanadaCaribbean small statesCentral African RepublicCentral Europe and the BalticsChileChinaColombiaCongo, Dem. Rep.Congo, Rep.Costa RicaCote d'IvoireCroatiaCubaCyprusCzech RepublicDenmarkDominicaDominican RepublicEarly-demographic dividendEast Asia & PacificEast Asia & Pacific (excluding high income)East Asia & Pacific (IDA & IBRD countries)EcuadorEgypt, Arab Rep.El SalvadorEstoniaEthiopiaEuro areaEurope & Central AsiaEurope & Central Asia (excluding high income)Europe & Central Asia (IDA & IBRD countries)European UnionFaroe IslandsFijiFinlandFragile and conflict affected situationsFranceFrench PolynesiaGabonGambia, TheGeorgiaGermanyGhanaGibraltarGreeceGreenlandGrenadaGuatemalaGuineaGuyanaHaitiHeavily indebted poor countries (HIPC)High incomeHondurasHong Kong SAR, ChinaHungaryIBRD onlyIcelandIDA & IBRD totalIDA blendIDA onlyIDA totalIndiaIndonesiaIran, Islamic Rep.IraqIrelandIsraelItalyJamaicaJapanJordanKazakhstanKenyaKorea, Dem. People’s Rep.Korea, Rep.KuwaitKyrgyz RepublicLate-demographic dividendLatin America & Caribbean Latin America & Caribbean (excluding high income)Latin America & the Caribbean (IDA & IBRD countries)LatviaLeast developed countries: UN classificationLebanonLiberiaLibyaLithuaniaLow & middle incomeLow incomeLower middle incomeLuxembourgMacao SAR, ChinaMacedonia, FYRMadagascarMalawiMalaysiaMaldivesMaliMaltaMauritaniaMauritiusMexicoMiddle East & North AfricaMiddle East & North Africa (excluding high income)Middle East & North Africa (IDA & IBRD countries)Middle incomeMoldovaMongoliaMontenegroMoroccoMozambiqueNetherlandsNew CaledoniaNew ZealandNicaraguaNigerNigeriaNorth AmericaNorwayOECD membersOmanOther small statesPacific island small statesPakistanPanamaPapua New GuineaParaguayPeruPhilippinesPolandPortugalPost-demographic dividendPre-demographic dividendQatarRomaniaRussian FederationSaudi ArabiaSenegalSerbiaSierra LeoneSingaporeSlovak RepublicSloveniaSmall statesSomaliaSouth AfricaSouth AsiaSouth Asia (IDA & IBRD)SpainSri LankaSt. Kitts and NevisSt. LuciaSt. Vincent and the GrenadinesSub-Saharan Africa Sub-Saharan Africa (excluding high income)Sub-Saharan Africa (IDA & IBRD countries)SudanSurinameSwedenSwitzerlandSyrian Arab RepublicTanzaniaThailandTogoTrinidad and TobagoTunisiaTurkeyUgandaUkraineUnited Arab EmiratesUnited KingdomUnited StatesUpper middle incomeUruguayVenezuela, RBVietnamWorldYemen, Rep.ZambiaZimbabwe línea de tiempo (timeline):
En esta escala de tiempo se presenta un gráfico de 1961 y 2015 de Madagascar. Los datos de 1960 están ausentes. El número de observaciones reales por fecha: 55.
Fuente (nombre):
Indicadores del desarrollo mundial
Fuente (organización):
World Bank staff estimates based data from International Monetary Fund's Direction of Trade database.
Categorías:
Private Sector, Trade
Se ha actualizado:
23 abr 2017 año
Los indicadores de los cambios de valor en los últimos años
Máximo:
2.251
1 ene 1998 año
A la fecha de observación
Valor
Cambio absoluto
El cambio con respecto al valor anterior
1 ene 1961 año
0.09
+0.09
0.0%
1 ene 1962 año
0.0
-0.09
-100.0%
1 ene 1966 año
0.684
+0.684
%
1 ene 1967 año
0.071
-0.613
-89.63%
1 ene 1968 año
0.0
-0.071
-100.0%
1 ene 1978 año
1.732
+1.732
%
1 ene 1979 año
0.531
-1.2
-69.31%
1 ene 1980 año
0.627
+0.095
17.96%
1 ene 1981 año
0.0
-0.627
-100.0%
1 ene 1987 año
0.332
+0.332
%
1 ene 1988 año
0.087
-0.245
-73.88%
1 ene 1989 año
0.37
+0.284
327.1%
1 ene 1990 año
0.767
+0.396
107.07%
1 ene 1991 año
0.864
+0.097
12.71%
1 ene 1992 año
1.066
+0.202
23.39%
1 ene 1993 año
0.611
-0.455
-42.67%
1 ene 1994 año
0.992
+0.381
62.26%
1 ene 1995 año
0.416
-0.576
-58.1%
1 ene 1996 año
1.34
+0.925
222.48%
1 ene 1997 año
0.348
-0.993
-74.07%
1 ene 1998 año
2.251
+1.904
547.86%
1 ene 1999 año
1.148
-1.103
-48.99%
1 ene 2000 año
0.628
-0.52
-45.31%
1 ene 2001 año
0.785
+0.157
24.94%
1 ene 2002 año
0.946
+0.161
20.57%
1 ene 2003 año
1.555
+0.609
64.39%
1 ene 2004 año
1.068
-0.487
-31.32%
1 ene 2005 año
0.724
-0.344
-32.21%
1 ene 2006 año
0.824
+0.1
13.83%
1 ene 2007 año
0.248
-0.577
-69.96%
1 ene 2008 año
0.544
+0.296
119.67%
1 ene 2009 año
0.897
+0.353
64.88%
1 ene 2010 año
1.062
+0.165
18.4%
1 ene 2011 año
1.124
+0.062
5.86%
1 ene 2012 año
0.8
-0.324
-28.82%
1 ene 2013 año
1.361
+0.561
70.17%
1 ene 2014 año
0.522
-0.84
-61.68%
1 ene 2015 año
0.707
+0.185
35.41%
Ranking de los países por los datos estadísticos actuales


Comentarios: