29
/es/
es
AIzaSyAYiBZKx7MnpbEhh9jyipgxe19OcubqV5w
April 1, 2024
34394
Fragile and conflict affected situations
FCS
false
2
1
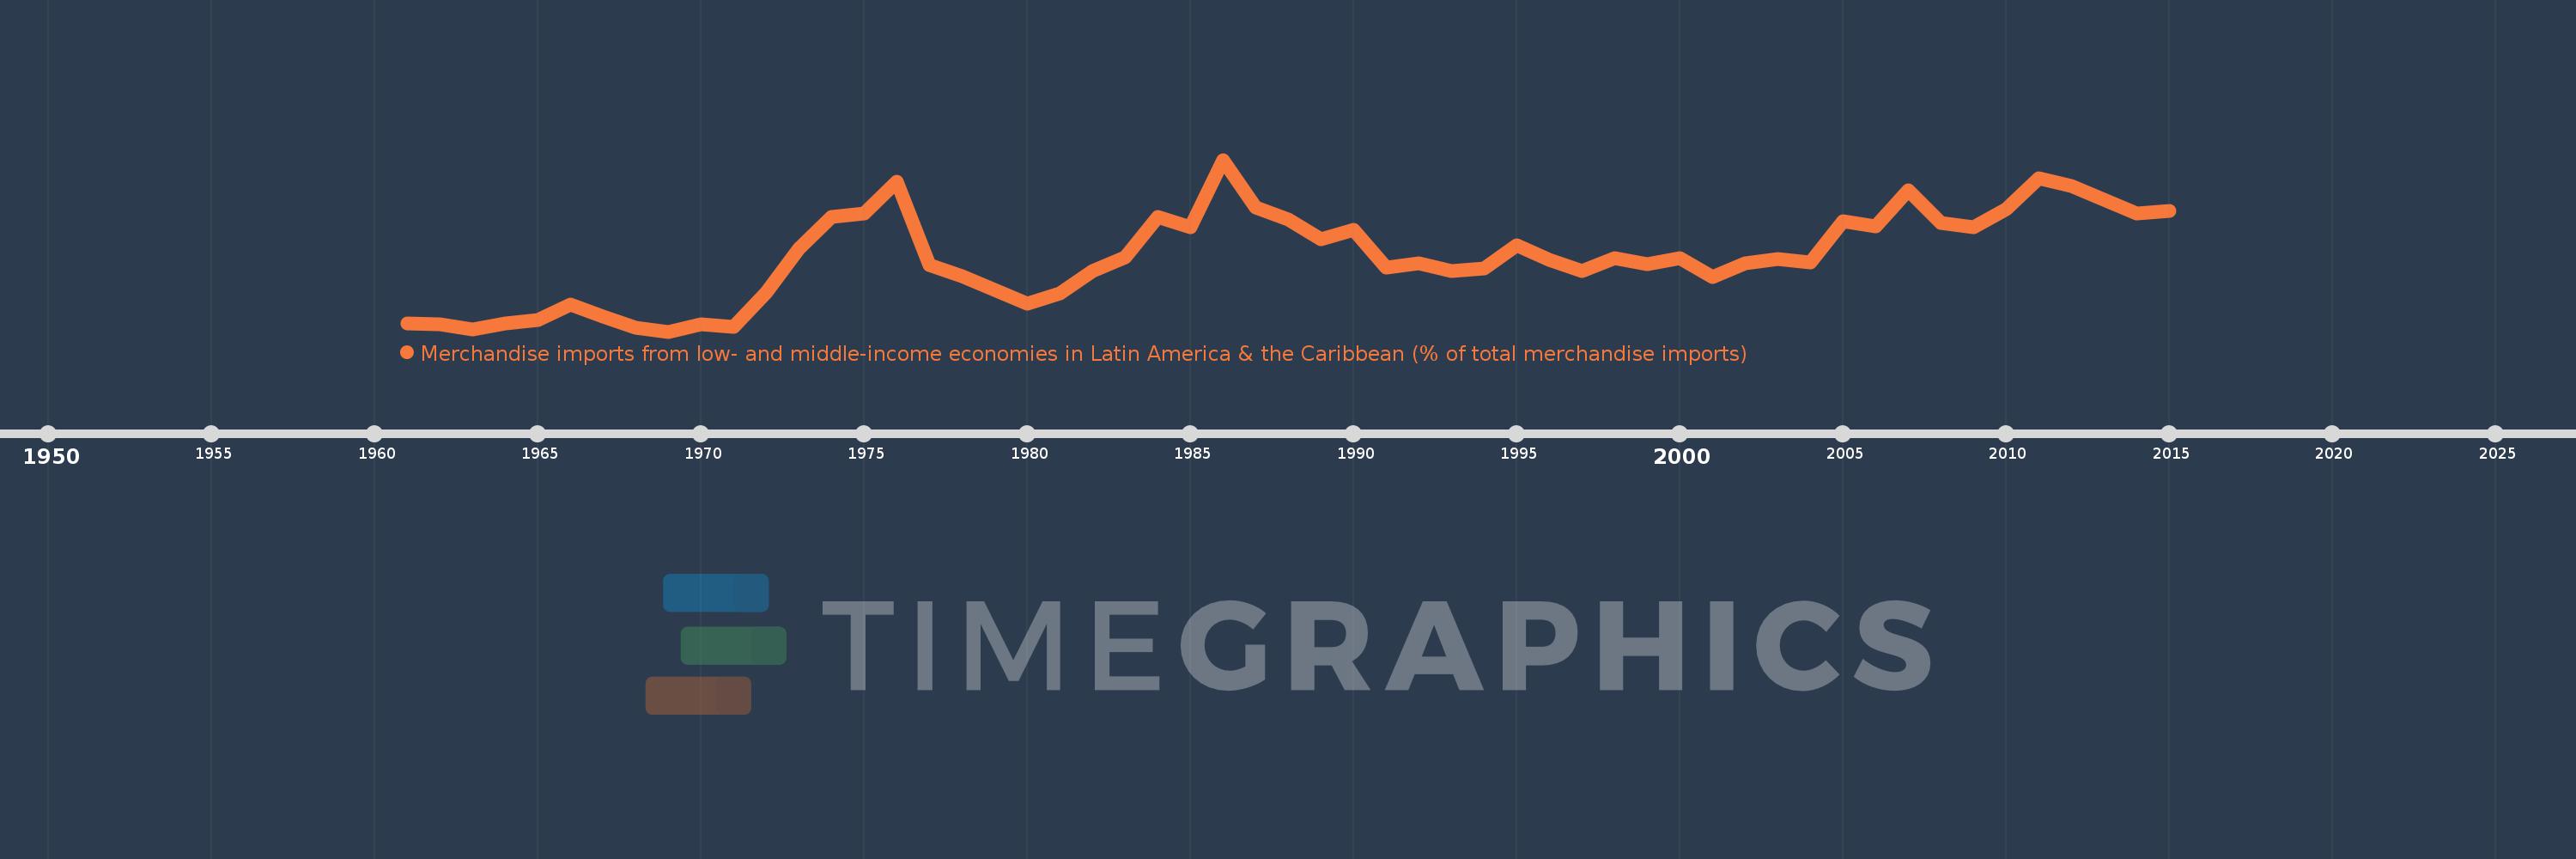
Merchandise imports from low- and middle-income economies in Latin America & the Caribbean (% of total merchandise imports)
2015,2014,2013,2012,2011,2010,2009,2008,2007,2006,2005,2004,2003,2002,2001,2000,1999,1998,1997,1996,1995,1994,1993,1992,1991,1990,1989,1988,1987,1986,1985,1984,1983,1982,1981,1980,1979,1978,1977,1976,1975,1974,1973,1972,1971,1970,1969,1968,1967,1966,1965,1964,1963,1962,1961
Estas estadísticas en otros países:
AfghanistanAlbaniaAlgeriaAngolaAntigua and BarbudaArab WorldArgentinaArmeniaArubaAustraliaAustriaAzerbaijanBahamas, TheBahrainBangladeshBarbadosBelarusBelgiumBelizeBeninBermudaBoliviaBrazilBrunei DarussalamBulgariaBurkina FasoCabo VerdeCambodiaCameroonCanadaCaribbean small statesCentral African RepublicCentral Europe and the BalticsChileChinaColombiaCongo, Dem. Rep.Congo, Rep.Costa RicaCote d'IvoireCroatiaCubaCyprusCzech RepublicDenmarkDominicaDominican RepublicEarly-demographic dividendEast Asia & PacificEast Asia & Pacific (excluding high income)East Asia & Pacific (IDA & IBRD countries)EcuadorEgypt, Arab Rep.El SalvadorEstoniaEthiopiaEuro areaEurope & Central AsiaEurope & Central Asia (excluding high income)Europe & Central Asia (IDA & IBRD countries)European UnionFaroe IslandsFijiFinlandFragile and conflict affected situationsFranceFrench PolynesiaGabonGambia, TheGeorgiaGermanyGhanaGibraltarGreeceGreenlandGrenadaGuatemalaGuineaGuyanaHaitiHeavily indebted poor countries (HIPC)High incomeHondurasHong Kong SAR, ChinaHungaryIBRD onlyIcelandIDA & IBRD totalIDA blendIDA onlyIDA totalIndiaIndonesiaIran, Islamic Rep.IraqIrelandIsraelItalyJamaicaJapanJordanKazakhstanKenyaKorea, Dem. People’s Rep.Korea, Rep.KuwaitKyrgyz RepublicLate-demographic dividendLatin America & Caribbean Latin America & Caribbean (excluding high income)Latin America & the Caribbean (IDA & IBRD countries)LatviaLeast developed countries: UN classificationLebanonLiberiaLibyaLithuaniaLow & middle incomeLow incomeLower middle incomeLuxembourgMacao SAR, ChinaMacedonia, FYRMadagascarMalawiMalaysiaMaldivesMaliMaltaMauritaniaMauritiusMexicoMiddle East & North AfricaMiddle East & North Africa (excluding high income)Middle East & North Africa (IDA & IBRD countries)Middle incomeMoldovaMongoliaMontenegroMoroccoMozambiqueNetherlandsNew CaledoniaNew ZealandNicaraguaNigerNigeriaNorth AmericaNorwayOECD membersOmanOther small statesPacific island small statesPakistanPanamaPapua New GuineaParaguayPeruPhilippinesPolandPortugalPost-demographic dividendPre-demographic dividendQatarRomaniaRussian FederationSaudi ArabiaSenegalSerbiaSierra LeoneSingaporeSlovak RepublicSloveniaSmall statesSomaliaSouth AfricaSouth AsiaSouth Asia (IDA & IBRD)SpainSri LankaSt. Kitts and NevisSt. LuciaSt. Vincent and the GrenadinesSub-Saharan Africa Sub-Saharan Africa (excluding high income)Sub-Saharan Africa (IDA & IBRD countries)SudanSurinameSwedenSwitzerlandSyrian Arab RepublicTanzaniaThailandTogoTrinidad and TobagoTunisiaTurkeyUgandaUkraineUnited Arab EmiratesUnited KingdomUnited StatesUpper middle incomeUruguayVenezuela, RBVietnamWorldYemen, Rep.ZambiaZimbabwe línea de tiempo (timeline):
En esta escala de tiempo se presenta un gráfico de 1961 y 2015 de Fragile and conflict affected situations. Los datos de 1960 están ausentes. El número de observaciones reales por fecha: 55.
Fuente (nombre):
Indicadores del desarrollo mundial
Fuente (organización):
World Bank staff estimates based data from International Monetary Fund's Direction of Trade database.
Categorías:
Private Sector, Trade
Se ha actualizado:
23 abr 2017 año
Los indicadores de los cambios de valor en los últimos años
Mínimo:
0.398
1 ene 1969 año
Máximo:
2.702
1 ene 1986 año
A la fecha de observación
Valor
Cambio absoluto
El cambio con respecto al valor anterior
1 ene 1961 año
0.509
+0.509
0.0%
1 ene 1962 año
0.497
-0.012
-2.42%
1 ene 1963 año
0.428
-0.069
-13.83%
1 ene 1964 año
0.507
+0.079
18.39%
1 ene 1965 año
0.548
+0.042
8.23%
1 ene 1966 año
0.758
+0.209
38.18%
1 ene 1967 año
0.599
-0.158
-20.89%
1 ene 1968 año
0.455
-0.144
-24.06%
1 ene 1969 año
0.398
-0.057
-12.57%
1 ene 1970 año
0.495
+0.097
24.45%
1 ene 1971 año
0.46
-0.035
-7.14%
1 ene 1972 año
0.92
+0.46
99.99%
1 ene 1973 año
1.514
+0.594
64.63%
1 ene 1974 año
1.932
+0.418
27.61%
1 ene 1975 año
1.982
+0.05
2.57%
1 ene 1976 año
2.412
+0.43
21.68%
1 ene 1977 año
1.287
-1.125
-46.64%
1 ene 1978 año
1.142
-0.144
-11.22%
1 ene 1979 año
0.961
-0.182
-15.9%
1 ene 1980 año
0.775
-0.186
-19.35%
1 ene 1981 año
0.913
+0.138
17.87%
1 ene 1982 año
1.212
+0.299
32.7%
1 ene 1983 año
1.4
+0.188
15.53%
1 ene 1984 año
1.933
+0.533
38.07%
1 ene 1985 año
1.796
-0.137
-7.09%
1 ene 1986 año
2.702
+0.905
50.39%
1 ene 1987 año
2.066
-0.635
-23.51%
1 ene 1988 año
1.905
-0.161
-7.79%
1 ene 1989 año
1.639
-0.266
-13.98%
1 ene 1990 año
1.765
+0.126
7.67%
1 ene 1991 año
1.262
-0.503
-28.5%
1 ene 1992 año
1.311
+0.049
3.92%
1 ene 1993 año
1.212
-0.099
-7.57%
1 ene 1994 año
1.247
+0.035
2.9%
1 ene 1995 año
1.561
+0.314
25.14%
1 ene 1996 año
1.357
-0.204
-13.07%
1 ene 1997 año
1.207
-0.15
-11.04%
1 ene 1998 año
1.382
+0.175
14.48%
1 ene 1999 año
1.302
-0.08
-5.76%
1 ene 2000 año
1.384
+0.082
6.26%
1 ene 2001 año
1.134
-0.249
-18.0%
1 ene 2002 año
1.319
+0.185
16.29%
1 ene 2003 año
1.377
+0.058
4.39%
1 ene 2004 año
1.324
-0.053
-3.83%
1 ene 2005 año
1.883
+0.559
42.18%
1 ene 2006 año
1.812
-0.071
-3.76%
1 ene 2007 año
2.298
+0.486
26.82%
1 ene 2008 año
1.857
-0.441
-19.18%
1 ene 2009 año
1.792
-0.065
-3.5%
1 ene 2010 año
2.044
+0.251
14.02%
1 ene 2011 año
2.449
+0.405
19.83%
1 ene 2012 año
2.346
-0.103
-4.19%
1 ene 2013 año
2.164
-0.182
-7.77%
1 ene 2014 año
1.979
-0.185
-8.55%
1 ene 2015 año
2.013
+0.034
1.74%
Ranking de los países por los datos estadísticos actuales


Comentarios: