29
/es/
es
AIzaSyAYiBZKx7MnpbEhh9jyipgxe19OcubqV5w
April 1, 2024
29286
East Asia & Pacific (IDA & IBRD countries)
TEA
false
2
1
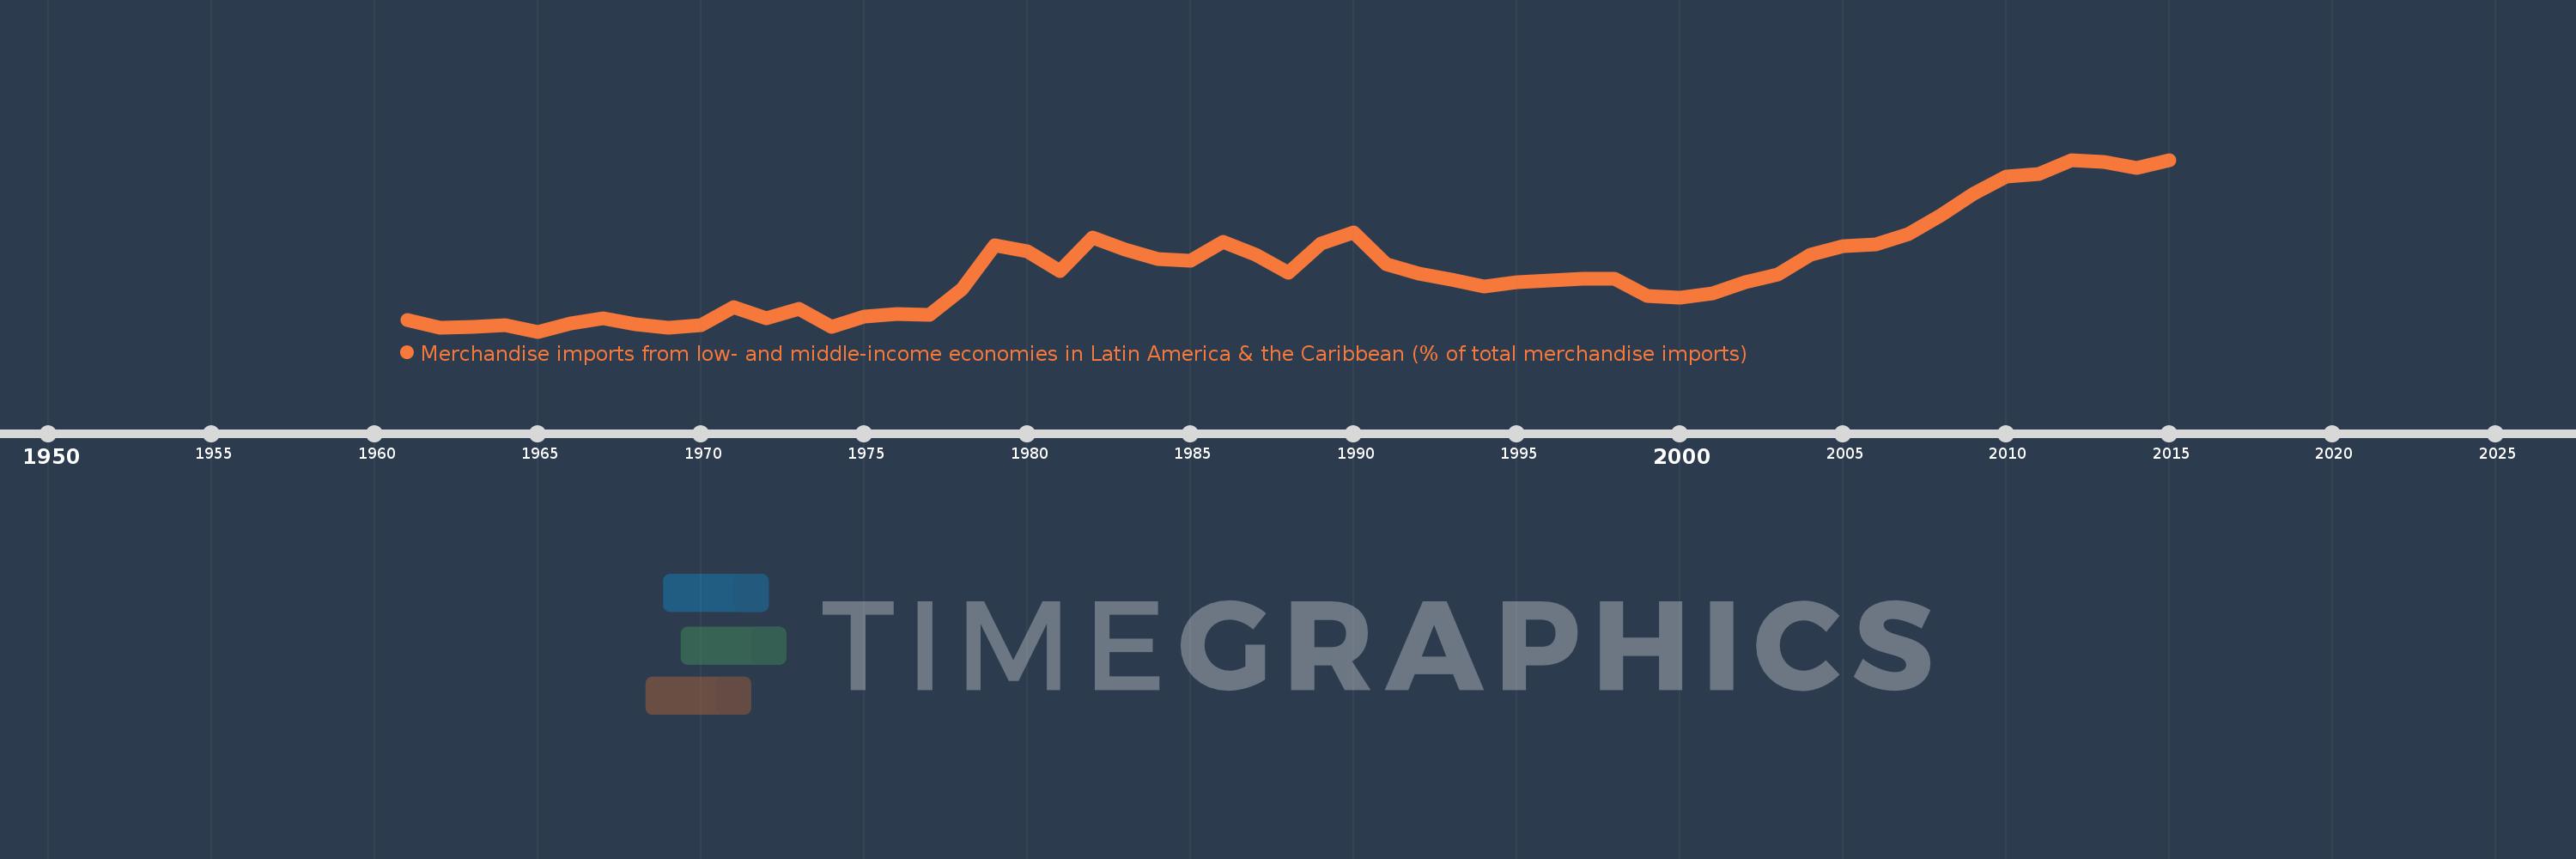
Merchandise imports from low- and middle-income economies in Latin America & the Caribbean (% of total merchandise imports)
2015,2014,2013,2012,2011,2010,2009,2008,2007,2006,2005,2004,2003,2002,2001,2000,1999,1998,1997,1996,1995,1994,1993,1992,1991,1990,1989,1988,1987,1986,1985,1984,1983,1982,1981,1980,1979,1978,1977,1976,1975,1974,1973,1972,1971,1970,1969,1968,1967,1966,1965,1964,1963,1962,1961
Estas estadísticas en otros países:
AfghanistanAlbaniaAlgeriaAngolaAntigua and BarbudaArab WorldArgentinaArmeniaArubaAustraliaAustriaAzerbaijanBahamas, TheBahrainBangladeshBarbadosBelarusBelgiumBelizeBeninBermudaBoliviaBrazilBrunei DarussalamBulgariaBurkina FasoCabo VerdeCambodiaCameroonCanadaCaribbean small statesCentral African RepublicCentral Europe and the BalticsChileChinaColombiaCongo, Dem. Rep.Congo, Rep.Costa RicaCote d'IvoireCroatiaCubaCyprusCzech RepublicDenmarkDominicaDominican RepublicEarly-demographic dividendEast Asia & PacificEast Asia & Pacific (excluding high income)East Asia & Pacific (IDA & IBRD countries)EcuadorEgypt, Arab Rep.El SalvadorEstoniaEthiopiaEuro areaEurope & Central AsiaEurope & Central Asia (excluding high income)Europe & Central Asia (IDA & IBRD countries)European UnionFaroe IslandsFijiFinlandFragile and conflict affected situationsFranceFrench PolynesiaGabonGambia, TheGeorgiaGermanyGhanaGibraltarGreeceGreenlandGrenadaGuatemalaGuineaGuyanaHaitiHeavily indebted poor countries (HIPC)High incomeHondurasHong Kong SAR, ChinaHungaryIBRD onlyIcelandIDA & IBRD totalIDA blendIDA onlyIDA totalIndiaIndonesiaIran, Islamic Rep.IraqIrelandIsraelItalyJamaicaJapanJordanKazakhstanKenyaKorea, Dem. People’s Rep.Korea, Rep.KuwaitKyrgyz RepublicLate-demographic dividendLatin America & Caribbean Latin America & Caribbean (excluding high income)Latin America & the Caribbean (IDA & IBRD countries)LatviaLeast developed countries: UN classificationLebanonLiberiaLibyaLithuaniaLow & middle incomeLow incomeLower middle incomeLuxembourgMacao SAR, ChinaMacedonia, FYRMadagascarMalawiMalaysiaMaldivesMaliMaltaMauritaniaMauritiusMexicoMiddle East & North AfricaMiddle East & North Africa (excluding high income)Middle East & North Africa (IDA & IBRD countries)Middle incomeMoldovaMongoliaMontenegroMoroccoMozambiqueNetherlandsNew CaledoniaNew ZealandNicaraguaNigerNigeriaNorth AmericaNorwayOECD membersOmanOther small statesPacific island small statesPakistanPanamaPapua New GuineaParaguayPeruPhilippinesPolandPortugalPost-demographic dividendPre-demographic dividendQatarRomaniaRussian FederationSaudi ArabiaSenegalSerbiaSierra LeoneSingaporeSlovak RepublicSloveniaSmall statesSomaliaSouth AfricaSouth AsiaSouth Asia (IDA & IBRD)SpainSri LankaSt. Kitts and NevisSt. LuciaSt. Vincent and the GrenadinesSub-Saharan Africa Sub-Saharan Africa (excluding high income)Sub-Saharan Africa (IDA & IBRD countries)SudanSurinameSwedenSwitzerlandSyrian Arab RepublicTanzaniaThailandTogoTrinidad and TobagoTunisiaTurkeyUgandaUkraineUnited Arab EmiratesUnited KingdomUnited StatesUpper middle incomeUruguayVenezuela, RBVietnamWorldYemen, Rep.ZambiaZimbabwe línea de tiempo (timeline):
En esta escala de tiempo se presenta un gráfico de 1961 y 2015 de East Asia & Pacific (IDA & IBRD countries). Los datos de 1960 están ausentes. El número de observaciones reales por fecha: 55.
Fuente (nombre):
Indicadores del desarrollo mundial
Fuente (organización):
World Bank staff estimates based data from International Monetary Fund's Direction of Trade database.
Categorías:
Private Sector, Trade
Se ha actualizado:
23 abr 2017 año
Los indicadores de los cambios de valor en los últimos años
Mínimo:
0.209
1 ene 1965 año
Máximo:
3.53
1 ene 2012 año
A la fecha de observación
Valor
Cambio absoluto
El cambio con respecto al valor anterior
1 ene 1961 año
0.439
+0.439
0.0%
1 ene 1962 año
0.288
-0.151
-34.4%
1 ene 1963 año
0.304
+0.015
5.35%
1 ene 1964 año
0.335
+0.032
10.45%
1 ene 1965 año
0.209
-0.126
-37.68%
1 ene 1966 año
0.367
+0.158
75.49%
1 ene 1967 año
0.473
+0.107
29.05%
1 ene 1968 año
0.358
-0.115
-24.35%
1 ene 1969 año
0.277
-0.081
-22.57%
1 ene 1970 año
0.334
+0.057
20.56%
1 ene 1971 año
0.69
+0.356
106.57%
1 ene 1972 año
0.461
-0.229
-33.22%
1 ene 1973 año
0.644
+0.183
39.67%
1 ene 1974 año
0.298
-0.346
-53.73%
1 ene 1975 año
0.494
+0.197
65.99%
1 ene 1976 año
0.546
+0.052
10.52%
1 ene 1977 año
0.526
-0.02
-3.74%
1 ene 1978 año
1.031
+0.505
96.06%
1 ene 1979 año
1.884
+0.853
82.71%
1 ene 1980 año
1.757
-0.127
-6.74%
1 ene 1981 año
1.373
-0.384
-21.87%
1 ene 1982 año
2.026
+0.653
47.54%
1 ene 1983 año
1.793
-0.233
-11.49%
1 ene 1984 año
1.612
-0.181
-10.08%
1 ene 1985 año
1.575
-0.037
-2.28%
1 ene 1986 año
1.939
+0.364
23.12%
1 ene 1987 año
1.694
-0.246
-12.67%
1 ene 1988 año
1.342
-0.352
-20.77%
1 ene 1989 año
1.906
+0.564
42.02%
1 ene 1990 año
2.13
+0.224
11.74%
1 ene 1991 año
1.509
-0.621
-29.15%
1 ene 1992 año
1.328
-0.18
-11.96%
1 ene 1993 año
1.214
-0.114
-8.6%
1 ene 1994 año
1.087
-0.127
-10.45%
1 ene 1995 año
1.16
+0.072
6.65%
1 ene 1996 año
1.202
+0.043
3.7%
1 ene 1997 año
1.235
+0.032
2.69%
1 ene 1998 año
1.225
-0.01
-0.8%
1 ene 1999 año
0.898
-0.326
-26.65%
1 ene 2000 año
0.867
-0.032
-3.55%
1 ene 2001 año
0.956
+0.089
10.27%
1 ene 2002 año
1.162
+0.206
21.6%
1 ene 2003 año
1.308
+0.146
12.56%
1 ene 2004 año
1.693
+0.385
29.42%
1 ene 2005 año
1.858
+0.166
9.8%
1 ene 2006 año
1.899
+0.04
2.17%
1 ene 2007 año
2.096
+0.197
10.36%
1 ene 2008 año
2.463
+0.368
17.55%
1 ene 2009 año
2.88
+0.417
16.92%
1 ene 2010 año
3.207
+0.327
11.36%
1 ene 2011 año
3.251
+0.044
1.36%
1 ene 2012 año
3.53
+0.279
8.59%
1 ene 2013 año
3.49
-0.04
-1.13%
1 ene 2014 año
3.378
-0.113
-3.23%
1 ene 2015 año
3.53
+0.152
4.5%
Ranking de los países por los datos estadísticos actuales


Comentarios: