29
/es/
es
AIzaSyAYiBZKx7MnpbEhh9jyipgxe19OcubqV5w
April 1, 2024
240695
Singapore
SGP
true
2
1
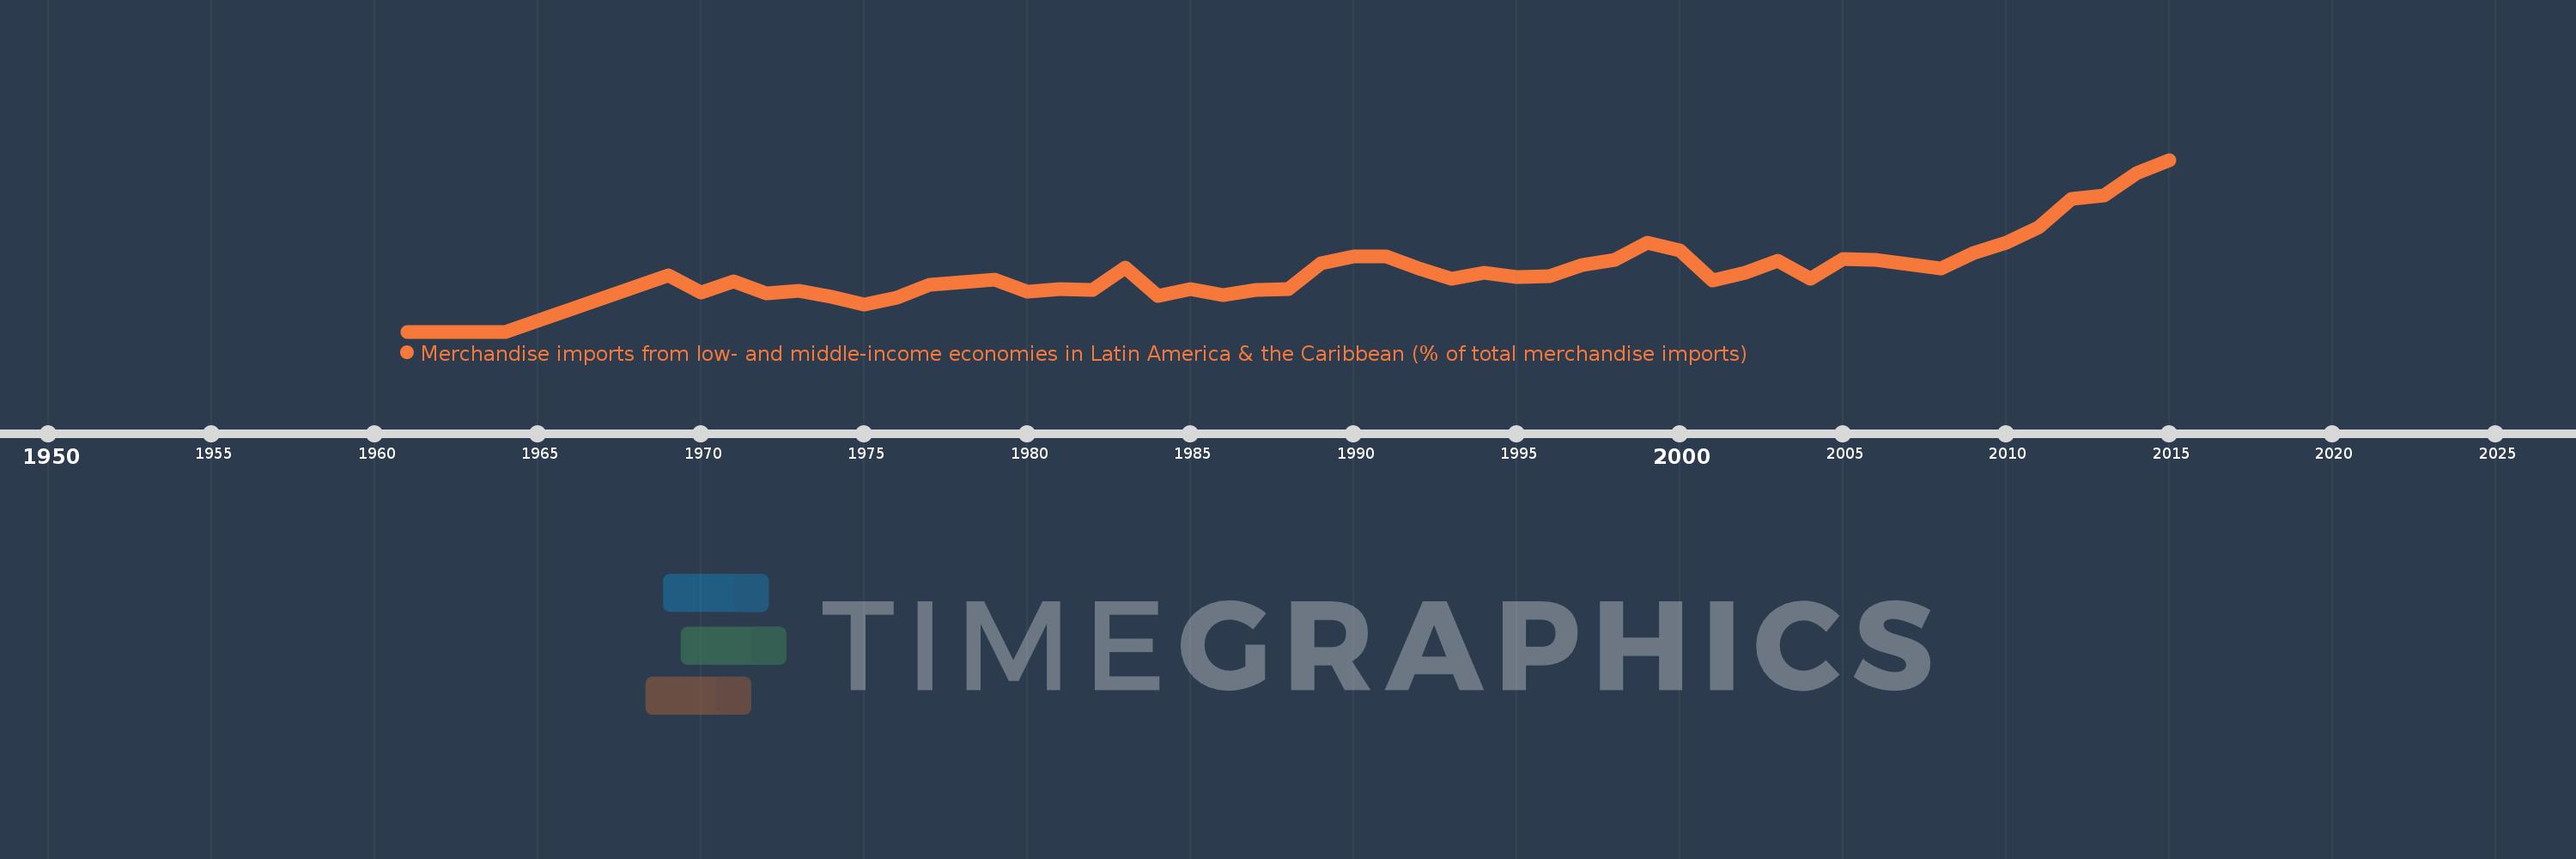
Merchandise imports from low- and middle-income economies in Latin America & the Caribbean (% of total merchandise imports)
2015,2014,2013,2012,2011,2010,2009,2008,2007,2006,2005,2004,2003,2002,2001,2000,1999,1998,1997,1996,1995,1994,1993,1992,1991,1990,1989,1988,1987,1986,1985,1984,1983,1982,1981,1980,1979,1978,1977,1976,1975,1974,1973,1972,1971,1970,1969,1964,1963,1961
Estas estadísticas en otros países:
AfghanistanAlbaniaAlgeriaAngolaAntigua and BarbudaArab WorldArgentinaArmeniaArubaAustraliaAustriaAzerbaijanBahamas, TheBahrainBangladeshBarbadosBelarusBelgiumBelizeBeninBermudaBoliviaBrazilBrunei DarussalamBulgariaBurkina FasoCabo VerdeCambodiaCameroonCanadaCaribbean small statesCentral African RepublicCentral Europe and the BalticsChileChinaColombiaCongo, Dem. Rep.Congo, Rep.Costa RicaCote d'IvoireCroatiaCubaCyprusCzech RepublicDenmarkDominicaDominican RepublicEarly-demographic dividendEast Asia & PacificEast Asia & Pacific (excluding high income)East Asia & Pacific (IDA & IBRD countries)EcuadorEgypt, Arab Rep.El SalvadorEstoniaEthiopiaEuro areaEurope & Central AsiaEurope & Central Asia (excluding high income)Europe & Central Asia (IDA & IBRD countries)European UnionFaroe IslandsFijiFinlandFragile and conflict affected situationsFranceFrench PolynesiaGabonGambia, TheGeorgiaGermanyGhanaGibraltarGreeceGreenlandGrenadaGuatemalaGuineaGuyanaHaitiHeavily indebted poor countries (HIPC)High incomeHondurasHong Kong SAR, ChinaHungaryIBRD onlyIcelandIDA & IBRD totalIDA blendIDA onlyIDA totalIndiaIndonesiaIran, Islamic Rep.IraqIrelandIsraelItalyJamaicaJapanJordanKazakhstanKenyaKorea, Dem. People’s Rep.Korea, Rep.KuwaitKyrgyz RepublicLate-demographic dividendLatin America & Caribbean Latin America & Caribbean (excluding high income)Latin America & the Caribbean (IDA & IBRD countries)LatviaLeast developed countries: UN classificationLebanonLiberiaLibyaLithuaniaLow & middle incomeLow incomeLower middle incomeLuxembourgMacao SAR, ChinaMacedonia, FYRMadagascarMalawiMalaysiaMaldivesMaliMaltaMauritaniaMauritiusMexicoMiddle East & North AfricaMiddle East & North Africa (excluding high income)Middle East & North Africa (IDA & IBRD countries)Middle incomeMoldovaMongoliaMontenegroMoroccoMozambiqueNetherlandsNew CaledoniaNew ZealandNicaraguaNigerNigeriaNorth AmericaNorwayOECD membersOmanOther small statesPacific island small statesPakistanPanamaPapua New GuineaParaguayPeruPhilippinesPolandPortugalPost-demographic dividendPre-demographic dividendQatarRomaniaRussian FederationSaudi ArabiaSenegalSerbiaSierra LeoneSingaporeSlovak RepublicSloveniaSmall statesSomaliaSouth AfricaSouth AsiaSouth Asia (IDA & IBRD)SpainSri LankaSt. Kitts and NevisSt. LuciaSt. Vincent and the GrenadinesSub-Saharan Africa Sub-Saharan Africa (excluding high income)Sub-Saharan Africa (IDA & IBRD countries)SudanSurinameSwedenSwitzerlandSyrian Arab RepublicTanzaniaThailandTogoTrinidad and TobagoTunisiaTurkeyUgandaUkraineUnited Arab EmiratesUnited KingdomUnited StatesUpper middle incomeUruguayVenezuela, RBVietnamWorldYemen, Rep.ZambiaZimbabwe línea de tiempo (timeline):
En esta escala de tiempo se presenta un gráfico de 1961 y 2015 de Singapore. Los datos de 1960 están ausentes. El número de observaciones reales por fecha: 50.
Fuente (nombre):
Indicadores del desarrollo mundial
Fuente (organización):
World Bank staff estimates based data from International Monetary Fund's Direction of Trade database.
Categorías:
Private Sector, Trade
Se ha actualizado:
23 abr 2017 año
Los indicadores de los cambios de valor en los últimos años
Máximo:
1.769
1 ene 2015 año
A la fecha de observación
Valor
Cambio absoluto
El cambio con respecto al valor anterior
1 ene 1961 año
0.0
0.0
0.0%
1 ene 1969 año
0.579
+0.579
%
1 ene 1970 año
0.404
-0.175
-30.16%
1 ene 1971 año
0.514
+0.11
27.15%
1 ene 1972 año
0.391
-0.123
-23.91%
1 ene 1973 año
0.423
+0.032
8.11%
1 ene 1974 año
0.358
-0.065
-15.26%
1 ene 1975 año
0.275
-0.083
-23.15%
1 ene 1976 año
0.35
+0.075
27.3%
1 ene 1977 año
0.479
+0.129
36.75%
1 ene 1978 año
0.508
+0.028
5.94%
1 ene 1979 año
0.539
+0.032
6.25%
1 ene 1980 año
0.41
-0.13
-24.01%
1 ene 1981 año
0.44
+0.031
7.45%
1 ene 1982 año
0.432
-0.008
-1.93%
1 ene 1983 año
0.657
+0.225
52.19%
1 ene 1984 año
0.365
-0.292
-44.45%
1 ene 1985 año
0.439
+0.074
20.32%
1 ene 1986 año
0.374
-0.065
-14.81%
1 ene 1987 año
0.427
+0.053
14.18%
1 ene 1988 año
0.439
+0.012
2.77%
1 ene 1989 año
0.707
+0.267
60.85%
1 ene 1990 año
0.771
+0.064
9.12%
1 ene 1991 año
0.778
+0.007
0.96%
1 ene 1992 año
0.65
-0.129
-16.51%
1 ene 1993 año
0.54
-0.11
-16.86%
1 ene 1994 año
0.605
+0.065
11.96%
1 ene 1995 año
0.565
-0.039
-6.51%
1 ene 1996 año
0.57
+0.004
0.75%
1 ene 1997 año
0.682
+0.112
19.66%
1 ene 1998 año
0.737
+0.055
8.11%
1 ene 1999 año
0.914
+0.177
24.03%
1 ene 2000 año
0.833
-0.081
-8.82%
1 ene 2001 año
0.53
-0.303
-36.37%
1 ene 2002 año
0.605
+0.075
14.11%
1 ene 2003 año
0.726
+0.121
19.98%
1 ene 2004 año
0.54
-0.186
-25.61%
1 ene 2005 año
0.745
+0.205
37.93%
1 ene 2006 año
0.736
-0.009
-1.23%
1 ene 2007 año
0.696
-0.039
-5.36%
1 ene 2008 año
0.652
-0.045
-6.4%
1 ene 2009 año
0.813
+0.161
24.77%
1 ene 2010 año
0.917
+0.103
12.7%
1 ene 2011 año
1.079
+0.162
17.69%
1 ene 2012 año
1.368
+0.289
26.81%
1 ene 2013 año
1.403
+0.035
2.56%
1 ene 2014 año
1.633
+0.23
16.37%
1 ene 2015 año
1.769
+0.136
8.33%
Ranking de los países por los datos estadísticos actuales


Comentarios: