29
/es/
es
AIzaSyAYiBZKx7MnpbEhh9jyipgxe19OcubqV5w
April 1, 2024
191657
Malta
MLT
true
2
1
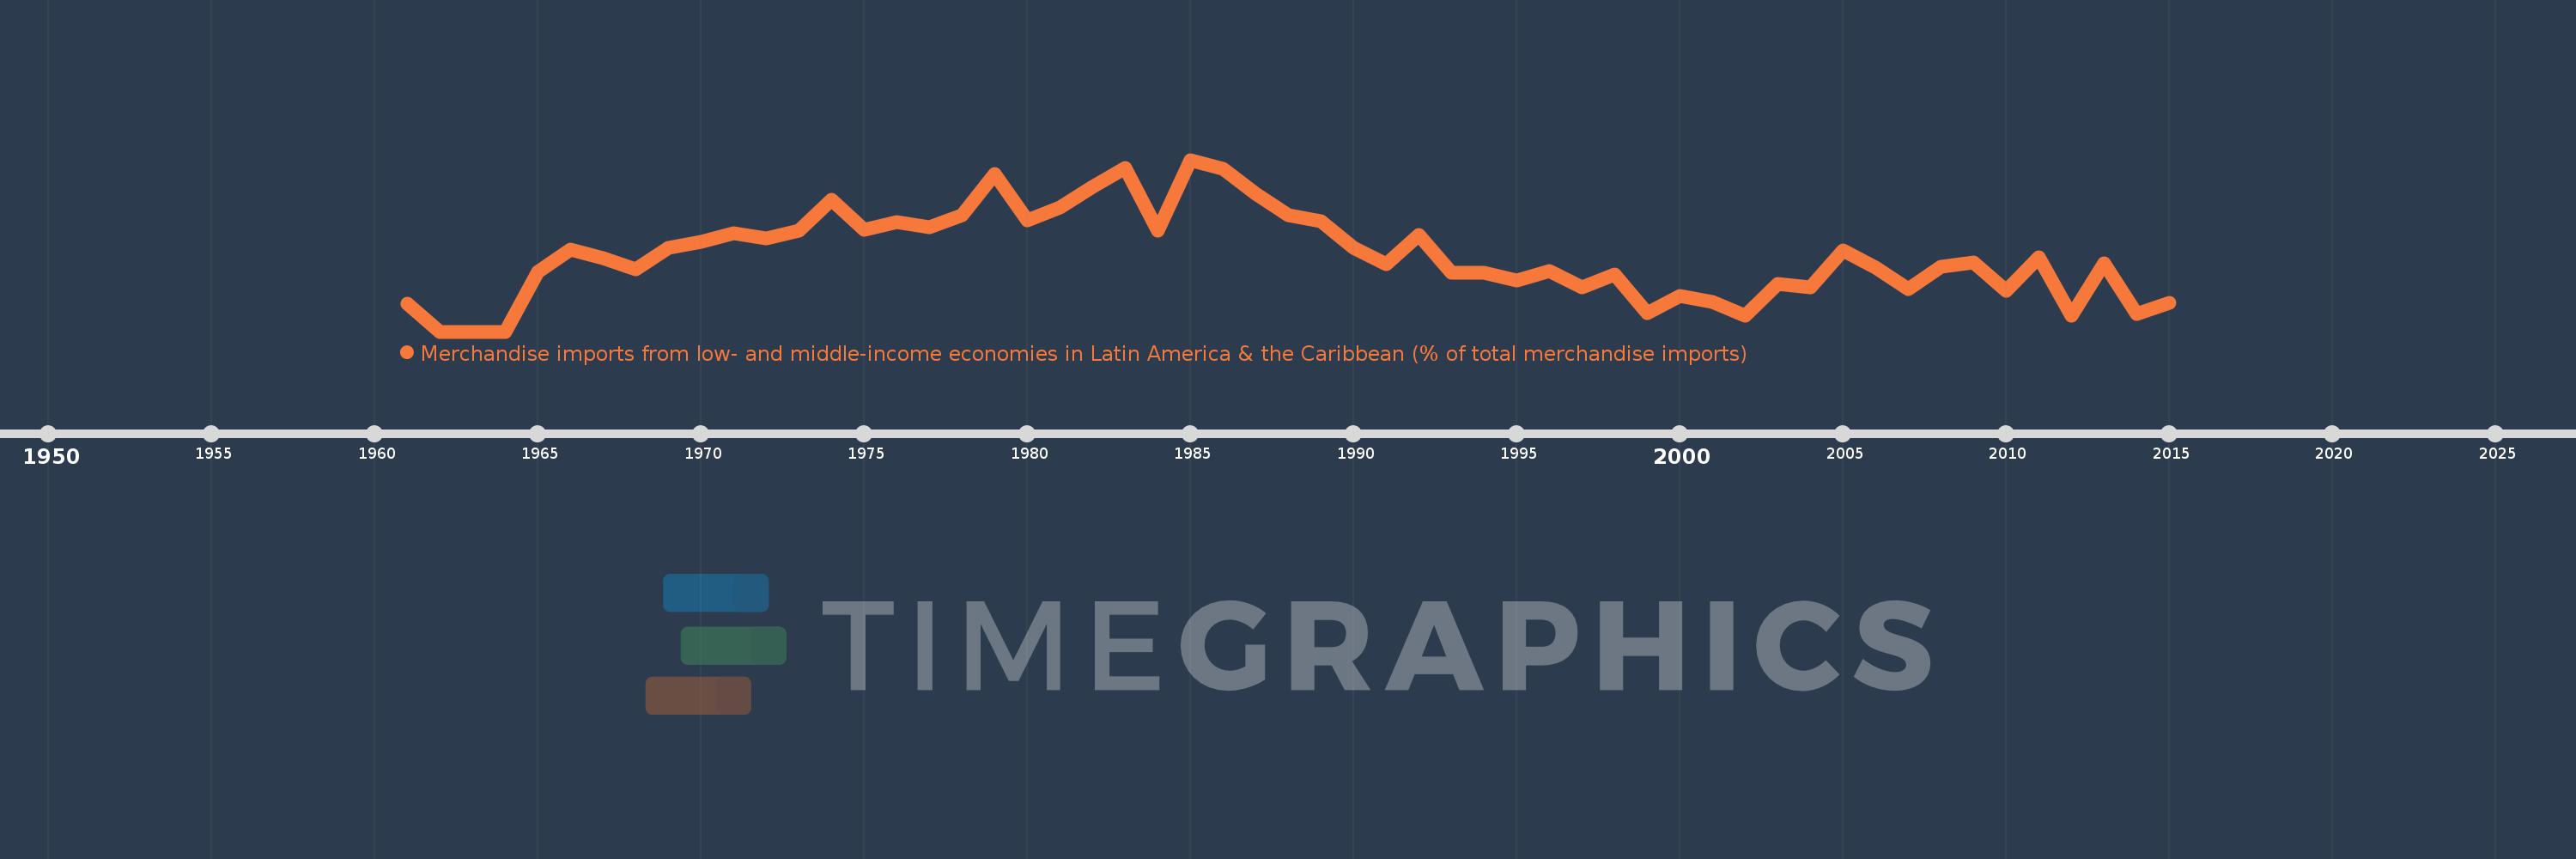
Merchandise imports from low- and middle-income economies in Latin America & the Caribbean (% of total merchandise imports)
2015,2014,2013,2012,2011,2010,2009,2008,2007,2006,2005,2004,2003,2002,2001,2000,1999,1998,1997,1996,1995,1994,1993,1992,1991,1990,1989,1988,1987,1986,1985,1984,1983,1982,1981,1980,1979,1978,1977,1976,1975,1974,1973,1972,1971,1970,1969,1968,1967,1966,1965,1964,1963,1962,1961
Estas estadísticas en otros países:
AfghanistanAlbaniaAlgeriaAngolaAntigua and BarbudaArab WorldArgentinaArmeniaArubaAustraliaAustriaAzerbaijanBahamas, TheBahrainBangladeshBarbadosBelarusBelgiumBelizeBeninBermudaBoliviaBrazilBrunei DarussalamBulgariaBurkina FasoCabo VerdeCambodiaCameroonCanadaCaribbean small statesCentral African RepublicCentral Europe and the BalticsChileChinaColombiaCongo, Dem. Rep.Congo, Rep.Costa RicaCote d'IvoireCroatiaCubaCyprusCzech RepublicDenmarkDominicaDominican RepublicEarly-demographic dividendEast Asia & PacificEast Asia & Pacific (excluding high income)East Asia & Pacific (IDA & IBRD countries)EcuadorEgypt, Arab Rep.El SalvadorEstoniaEthiopiaEuro areaEurope & Central AsiaEurope & Central Asia (excluding high income)Europe & Central Asia (IDA & IBRD countries)European UnionFaroe IslandsFijiFinlandFragile and conflict affected situationsFranceFrench PolynesiaGabonGambia, TheGeorgiaGermanyGhanaGibraltarGreeceGreenlandGrenadaGuatemalaGuineaGuyanaHaitiHeavily indebted poor countries (HIPC)High incomeHondurasHong Kong SAR, ChinaHungaryIBRD onlyIcelandIDA & IBRD totalIDA blendIDA onlyIDA totalIndiaIndonesiaIran, Islamic Rep.IraqIrelandIsraelItalyJamaicaJapanJordanKazakhstanKenyaKorea, Dem. People’s Rep.Korea, Rep.KuwaitKyrgyz RepublicLate-demographic dividendLatin America & Caribbean Latin America & Caribbean (excluding high income)Latin America & the Caribbean (IDA & IBRD countries)LatviaLeast developed countries: UN classificationLebanonLiberiaLibyaLithuaniaLow & middle incomeLow incomeLower middle incomeLuxembourgMacao SAR, ChinaMacedonia, FYRMadagascarMalawiMalaysiaMaldivesMaliMaltaMauritaniaMauritiusMexicoMiddle East & North AfricaMiddle East & North Africa (excluding high income)Middle East & North Africa (IDA & IBRD countries)Middle incomeMoldovaMongoliaMontenegroMoroccoMozambiqueNetherlandsNew CaledoniaNew ZealandNicaraguaNigerNigeriaNorth AmericaNorwayOECD membersOmanOther small statesPacific island small statesPakistanPanamaPapua New GuineaParaguayPeruPhilippinesPolandPortugalPost-demographic dividendPre-demographic dividendQatarRomaniaRussian FederationSaudi ArabiaSenegalSerbiaSierra LeoneSingaporeSlovak RepublicSloveniaSmall statesSomaliaSouth AfricaSouth AsiaSouth Asia (IDA & IBRD)SpainSri LankaSt. Kitts and NevisSt. LuciaSt. Vincent and the GrenadinesSub-Saharan Africa Sub-Saharan Africa (excluding high income)Sub-Saharan Africa (IDA & IBRD countries)SudanSurinameSwedenSwitzerlandSyrian Arab RepublicTanzaniaThailandTogoTrinidad and TobagoTunisiaTurkeyUgandaUkraineUnited Arab EmiratesUnited KingdomUnited StatesUpper middle incomeUruguayVenezuela, RBVietnamWorldYemen, Rep.ZambiaZimbabwe línea de tiempo (timeline):
En esta escala de tiempo se presenta un gráfico de 1961 y 2015 de Malta. Los datos de 1960 están ausentes. El número de observaciones reales por fecha: 55.
Fuente (nombre):
Indicadores del desarrollo mundial
Fuente (organización):
World Bank staff estimates based data from International Monetary Fund's Direction of Trade database.
Categorías:
Private Sector, Trade
Se ha actualizado:
23 abr 2017 año
Los indicadores de los cambios de valor en los últimos años
Máximo:
1.54
1 ene 1985 año
A la fecha de observación
Valor
Cambio absoluto
El cambio con respecto al valor anterior
1 ene 1961 año
0.253
+0.253
0.0%
1 ene 1962 año
0.0
-0.253
-100.0%
1 ene 1965 año
0.536
+0.536
%
1 ene 1966 año
0.733
+0.197
36.7%
1 ene 1967 año
0.655
-0.078
-10.7%
1 ene 1968 año
0.557
-0.098
-14.93%
1 ene 1969 año
0.754
+0.197
35.33%
1 ene 1970 año
0.808
+0.055
7.24%
1 ene 1971 año
0.884
+0.076
9.37%
1 ene 1972 año
0.834
-0.05
-5.61%
1 ene 1973 año
0.903
+0.069
8.24%
1 ene 1974 año
1.18
+0.277
30.62%
1 ene 1975 año
0.912
-0.268
-22.69%
1 ene 1976 año
0.985
+0.073
7.95%
1 ene 1977 año
0.939
-0.046
-4.65%
1 ene 1978 año
1.04
+0.101
10.81%
1 ene 1979 año
1.411
+0.371
35.64%
1 ene 1980 año
0.996
-0.414
-29.38%
1 ene 1981 año
1.111
+0.114
11.45%
1 ene 1982 año
1.299
+0.189
16.99%
1 ene 1983 año
1.466
+0.167
12.84%
1 ene 1984 año
0.905
-0.561
-38.27%
1 ene 1985 año
1.54
+0.635
70.12%
1 ene 1986 año
1.462
-0.077
-5.02%
1 ene 1987 año
1.238
-0.224
-15.33%
1 ene 1988 año
1.041
-0.197
-15.95%
1 ene 1989 año
0.988
-0.052
-5.02%
1 ene 1990 año
0.754
-0.234
-23.69%
1 ene 1991 año
0.604
-0.15
-19.93%
1 ene 1992 año
0.867
+0.263
43.5%
1 ene 1993 año
0.53
-0.337
-38.83%
1 ene 1994 año
0.529
-0.002
-0.28%
1 ene 1995 año
0.456
-0.073
-13.75%
1 ene 1996 año
0.546
+0.091
19.85%
1 ene 1997 año
0.396
-0.15
-27.45%
1 ene 1998 año
0.512
+0.116
29.16%
1 ene 1999 año
0.165
-0.348
-67.87%
1 ene 2000 año
0.322
+0.158
95.98%
1 ene 2001 año
0.267
-0.055
-17.05%
1 ene 2002 año
0.141
-0.126
-47.29%
1 ene 2003 año
0.427
+0.286
202.95%
1 ene 2004 año
0.394
-0.033
-7.72%
1 ene 2005 año
0.724
+0.33
83.62%
1 ene 2006 año
0.574
-0.15
-20.71%
1 ene 2007 año
0.382
-0.192
-33.41%
1 ene 2008 año
0.582
+0.199
52.18%
1 ene 2009 año
0.623
+0.041
7.1%
1 ene 2010 año
0.368
-0.255
-40.97%
1 ene 2011 año
0.669
+0.302
82.02%
1 ene 2012 año
0.141
-0.528
-78.91%
1 ene 2013 año
0.61
+0.469
331.92%
1 ene 2014 año
0.16
-0.449
-73.69%
1 ene 2015 año
0.26
+0.1
62.32%
Ranking de los países por los datos estadísticos actuales


Comentarios: