29
/es/
es
AIzaSyAYiBZKx7MnpbEhh9jyipgxe19OcubqV5w
April 1, 2024
30072
Euro area
EMU
false
2
1
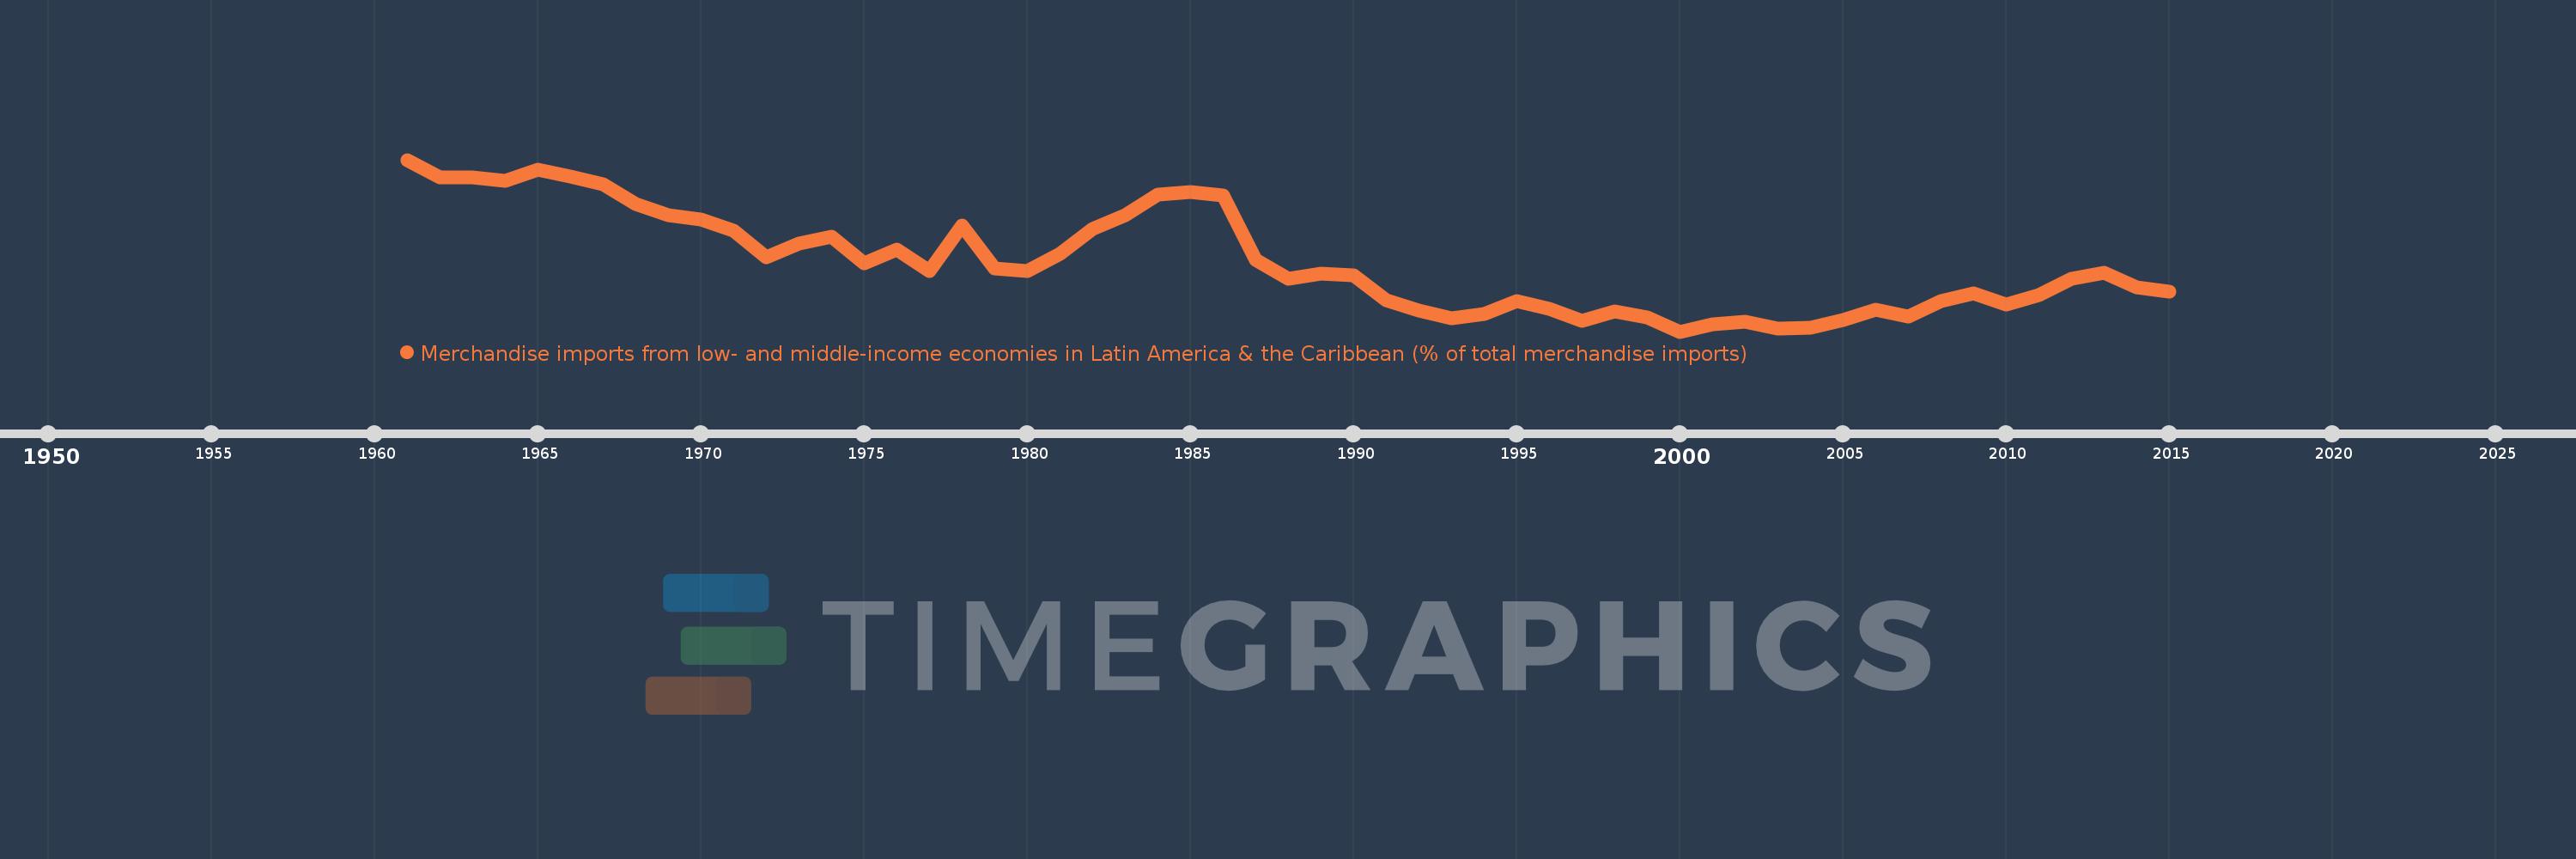
Merchandise imports from low- and middle-income economies in Latin America & the Caribbean (% of total merchandise imports)
2015,2014,2013,2012,2011,2010,2009,2008,2007,2006,2005,2004,2003,2002,2001,2000,1999,1998,1997,1996,1995,1994,1993,1992,1991,1990,1989,1988,1987,1986,1985,1984,1983,1982,1981,1980,1979,1978,1977,1976,1975,1974,1973,1972,1971,1970,1969,1968,1967,1966,1965,1964,1963,1962,1961
Estas estadísticas en otros países:
AfghanistanAlbaniaAlgeriaAngolaAntigua and BarbudaArab WorldArgentinaArmeniaArubaAustraliaAustriaAzerbaijanBahamas, TheBahrainBangladeshBarbadosBelarusBelgiumBelizeBeninBermudaBoliviaBrazilBrunei DarussalamBulgariaBurkina FasoCabo VerdeCambodiaCameroonCanadaCaribbean small statesCentral African RepublicCentral Europe and the BalticsChileChinaColombiaCongo, Dem. Rep.Congo, Rep.Costa RicaCote d'IvoireCroatiaCubaCyprusCzech RepublicDenmarkDominicaDominican RepublicEarly-demographic dividendEast Asia & PacificEast Asia & Pacific (excluding high income)East Asia & Pacific (IDA & IBRD countries)EcuadorEgypt, Arab Rep.El SalvadorEstoniaEthiopiaEuro areaEurope & Central AsiaEurope & Central Asia (excluding high income)Europe & Central Asia (IDA & IBRD countries)European UnionFaroe IslandsFijiFinlandFragile and conflict affected situationsFranceFrench PolynesiaGabonGambia, TheGeorgiaGermanyGhanaGibraltarGreeceGreenlandGrenadaGuatemalaGuineaGuyanaHaitiHeavily indebted poor countries (HIPC)High incomeHondurasHong Kong SAR, ChinaHungaryIBRD onlyIcelandIDA & IBRD totalIDA blendIDA onlyIDA totalIndiaIndonesiaIran, Islamic Rep.IraqIrelandIsraelItalyJamaicaJapanJordanKazakhstanKenyaKorea, Dem. People’s Rep.Korea, Rep.KuwaitKyrgyz RepublicLate-demographic dividendLatin America & Caribbean Latin America & Caribbean (excluding high income)Latin America & the Caribbean (IDA & IBRD countries)LatviaLeast developed countries: UN classificationLebanonLiberiaLibyaLithuaniaLow & middle incomeLow incomeLower middle incomeLuxembourgMacao SAR, ChinaMacedonia, FYRMadagascarMalawiMalaysiaMaldivesMaliMaltaMauritaniaMauritiusMexicoMiddle East & North AfricaMiddle East & North Africa (excluding high income)Middle East & North Africa (IDA & IBRD countries)Middle incomeMoldovaMongoliaMontenegroMoroccoMozambiqueNetherlandsNew CaledoniaNew ZealandNicaraguaNigerNigeriaNorth AmericaNorwayOECD membersOmanOther small statesPacific island small statesPakistanPanamaPapua New GuineaParaguayPeruPhilippinesPolandPortugalPost-demographic dividendPre-demographic dividendQatarRomaniaRussian FederationSaudi ArabiaSenegalSerbiaSierra LeoneSingaporeSlovak RepublicSloveniaSmall statesSomaliaSouth AfricaSouth AsiaSouth Asia (IDA & IBRD)SpainSri LankaSt. Kitts and NevisSt. LuciaSt. Vincent and the GrenadinesSub-Saharan Africa Sub-Saharan Africa (excluding high income)Sub-Saharan Africa (IDA & IBRD countries)SudanSurinameSwedenSwitzerlandSyrian Arab RepublicTanzaniaThailandTogoTrinidad and TobagoTunisiaTurkeyUgandaUkraineUnited Arab EmiratesUnited KingdomUnited StatesUpper middle incomeUruguayVenezuela, RBVietnamWorldYemen, Rep.ZambiaZimbabwe línea de tiempo (timeline):
En esta escala de tiempo se presenta un gráfico de 1961 y 2015 de Euro area. Los datos de 1960 están ausentes. El número de observaciones reales por fecha: 55.
Fuente (nombre):
Indicadores del desarrollo mundial
Fuente (organización):
World Bank staff estimates based data from International Monetary Fund's Direction of Trade database.
Categorías:
Private Sector, Trade
Se ha actualizado:
23 abr 2017 año
Los indicadores de los cambios de valor en los últimos años
Mínimo:
1.436
1 ene 2000 año
Máximo:
3.144
1 ene 1961 año
A la fecha de observación
Valor
Cambio absoluto
El cambio con respecto al valor anterior
1 ene 1961 año
3.144
+3.144
0.0%
1 ene 1962 año
2.97
-0.175
-5.56%
1 ene 1963 año
2.972
+0.003
0.1%
1 ene 1964 año
2.933
-0.039
-1.32%
1 ene 1965 año
3.044
+0.111
3.78%
1 ene 1966 año
2.976
-0.068
-2.22%
1 ene 1967 año
2.904
-0.072
-2.43%
1 ene 1968 año
2.702
-0.202
-6.96%
1 ene 1969 año
2.592
-0.11
-4.08%
1 ene 1970 año
2.549
-0.043
-1.65%
1 ene 1971 año
2.44
-0.109
-4.28%
1 ene 1972 año
2.174
-0.266
-10.9%
1 ene 1973 año
2.314
+0.14
6.44%
1 ene 1974 año
2.38
+0.066
2.84%
1 ene 1975 año
2.111
-0.269
-11.3%
1 ene 1976 año
2.255
+0.144
6.81%
1 ene 1977 año
2.034
-0.221
-9.78%
1 ene 1978 año
2.487
+0.453
22.27%
1 ene 1979 año
2.062
-0.425
-17.09%
1 ene 1980 año
2.039
-0.023
-1.12%
1 ene 1981 año
2.209
+0.17
8.32%
1 ene 1982 año
2.457
+0.249
11.27%
1 ene 1983 año
2.591
+0.134
5.45%
1 ene 1984 año
2.799
+0.208
8.02%
1 ene 1985 año
2.821
+0.022
0.77%
1 ene 1986 año
2.79
-0.031
-1.11%
1 ene 1987 año
2.153
-0.636
-22.81%
1 ene 1988 año
1.959
-0.194
-9.01%
1 ene 1989 año
2.01
+0.051
2.61%
1 ene 1990 año
1.994
-0.017
-0.83%
1 ene 1991 año
1.745
-0.248
-12.45%
1 ene 1992 año
1.645
-0.1
-5.73%
1 ene 1993 año
1.571
-0.074
-4.53%
1 ene 1994 año
1.61
+0.039
2.48%
1 ene 1995 año
1.737
+0.128
7.93%
1 ene 1996 año
1.664
-0.073
-4.21%
1 ene 1997 año
1.544
-0.12
-7.22%
1 ene 1998 año
1.638
+0.094
6.07%
1 ene 1999 año
1.576
-0.062
-3.77%
1 ene 2000 año
1.436
-0.14
-8.88%
1 ene 2001 año
1.508
+0.072
5.02%
1 ene 2002 año
1.53
+0.022
1.46%
1 ene 2003 año
1.468
-0.062
-4.06%
1 ene 2004 año
1.474
+0.005
0.37%
1 ene 2005 año
1.55
+0.077
5.22%
1 ene 2006 año
1.65
+0.099
6.41%
1 ene 2007 año
1.587
-0.063
-3.82%
1 ene 2008 año
1.739
+0.152
9.6%
1 ene 2009 año
1.82
+0.081
4.68%
1 ene 2010 año
1.702
-0.119
-6.53%
1 ene 2011 año
1.799
+0.097
5.7%
1 ene 2012 año
1.962
+0.164
9.1%
1 ene 2013 año
2.022
+0.06
3.06%
1 ene 2014 año
1.878
-0.144
-7.12%
1 ene 2015 año
1.834
-0.045
-2.37%
Ranking de los países por los datos estadísticos actuales


Comentarios: